EtsyInc ETSY full analysis,charts,indicators,moving averages,SMA,DMA,EMA,ADX,MACD,RSIEtsy Inc ETSY WideScreen charts, DMA,SMA,EMA technical analysis, forecast prediction, by indicators ADX,MACD,RSI,CCI USA stock exchange
operates under Miscellaneous sector & deals in Business Services
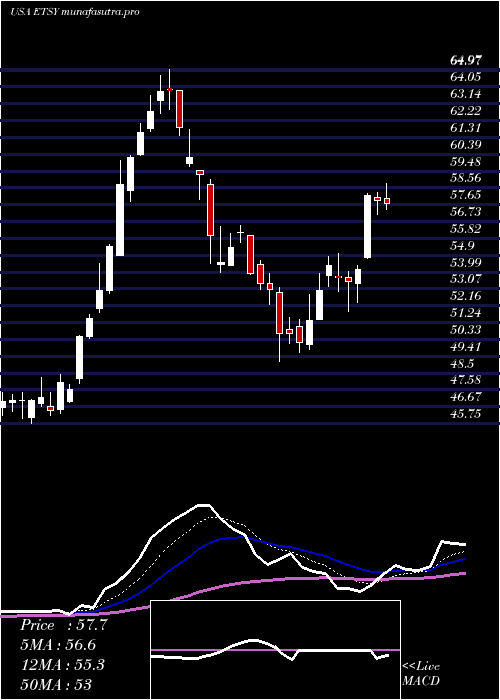
Daily price and charts and targets EtsyInc Strong Daily Stock price targets for EtsyInc ETSY are 50.35 and 52.86 | Daily Target 1 | 49.74 | | Daily Target 2 | 50.96 | | Daily Target 3 | 52.246666666667 | | Daily Target 4 | 53.47 | | Daily Target 5 | 54.76 |
Daily price and volume Etsy Inc
| Date |
Closing |
Open |
Range |
Volume |
Thu 04 December 2025 |
52.19 (-3.05%) |
53.27 |
51.02 - 53.53 |
1.2782 times |
Wed 03 December 2025 |
53.83 (-1.54%) |
54.65 |
53.30 - 54.77 |
0.8196 times |
Tue 02 December 2025 |
54.67 (-0.26%) |
54.78 |
54.08 - 54.99 |
0.6902 times |
Mon 01 December 2025 |
54.81 (1.09%) |
53.53 |
52.67 - 55.47 |
1.0621 times |
Fri 28 November 2025 |
54.22 (0.11%) |
54.17 |
54.02 - 55.15 |
0.3779 times |
Wed 26 November 2025 |
54.16 (0.33%) |
53.90 |
53.76 - 55.31 |
0.9607 times |
Tue 25 November 2025 |
53.98 (3.69%) |
52.87 |
52.23 - 55.04 |
1.1381 times |
Mon 24 November 2025 |
52.06 (-1.94%) |
52.72 |
51.54 - 53.26 |
1.2813 times |
Fri 21 November 2025 |
53.09 (2.95%) |
51.56 |
51.56 - 54.10 |
1.1948 times |
Thu 20 November 2025 |
51.57 (-2.9%) |
53.43 |
51.51 - 54.50 |
1.1971 times |
Wed 19 November 2025 |
53.11 (-2.55%) |
54.38 |
52.46 - 54.79 |
1.1369 times |
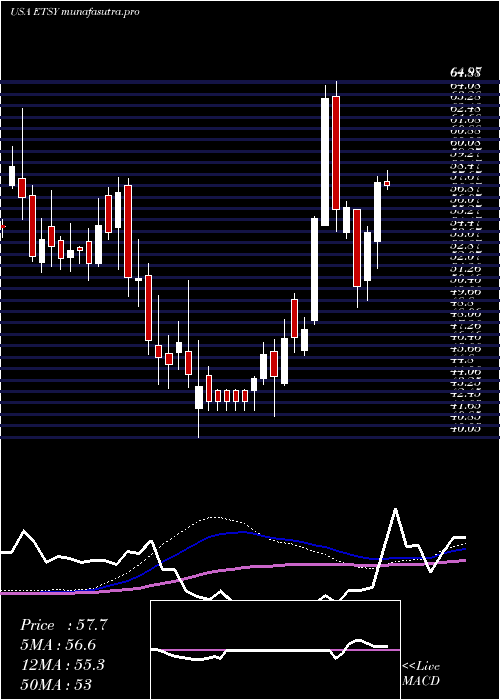
Weekly price and charts EtsyInc Strong weekly Stock price targets for EtsyInc ETSY are 49.38 and 53.83 | Weekly Target 1 | 48.44 | | Weekly Target 2 | 50.32 | | Weekly Target 3 | 52.893333333333 | | Weekly Target 4 | 54.77 | | Weekly Target 5 | 57.34 |
Weekly price and volumes for Etsy Inc
| Date |
Closing |
Open |
Range |
Volume |
Thu 04 December 2025 |
52.19 (-3.74%) |
53.53 |
51.02 - 55.47 |
0.9143 times |
Fri 28 November 2025 |
54.22 (2.13%) |
52.72 |
51.54 - 55.31 |
0.8924 times |
Fri 21 November 2025 |
53.09 (-7.02%) |
57.30 |
51.51 - 58.41 |
1.3599 times |
Fri 14 November 2025 |
57.10 (-3.37%) |
59.30 |
56.65 - 65.66 |
1.5803 times |
Fri 07 November 2025 |
59.09 (-4.69%) |
59.88 |
55.90 - 60.78 |
1.084 times |
Fri 31 October 2025 |
62.00 (0%) |
62.55 |
61.03 - 63.60 |
0.3296 times |
Fri 31 October 2025 |
62.00 (-16.1%) |
74.70 |
61.03 - 76.23 |
2.3731 times |
Fri 24 October 2025 |
73.90 (4.88%) |
71.22 |
70.53 - 75.89 |
0.8472 times |
Fri 17 October 2025 |
70.46 (0%) |
69.37 |
69.02 - 71.70 |
0.1612 times |
Fri 17 October 2025 |
70.46 (-1.39%) |
71.40 |
69.63 - 74.24 |
0.4581 times |
Thu 16 October 2025 |
71.45 (1.06%) |
72.04 |
70.18 - 74.45 |
0.5706 times |
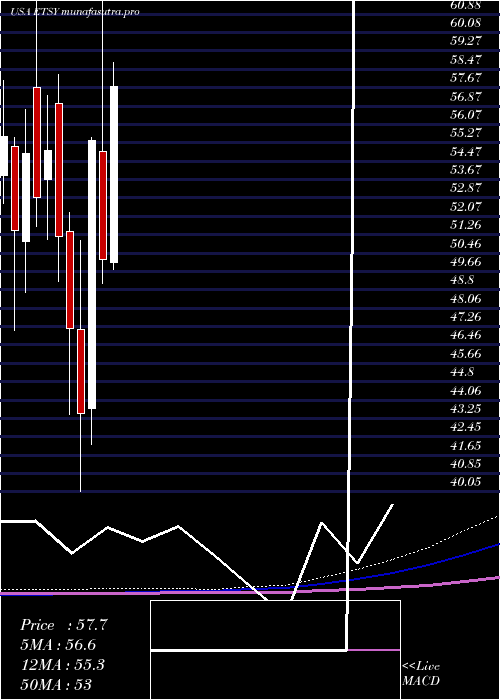
Monthly price and charts EtsyInc Strong monthly Stock price targets for EtsyInc ETSY are 49.38 and 53.83 | Monthly Target 1 | 48.44 | | Monthly Target 2 | 50.32 | | Monthly Target 3 | 52.893333333333 | | Monthly Target 4 | 54.77 | | Monthly Target 5 | 57.34 |
Monthly price and volumes Etsy Inc
| Date |
Closing |
Open |
Range |
Volume |
Thu 04 December 2025 |
52.19 (-3.74%) |
53.53 |
51.02 - 55.47 |
0.1325 times |
Fri 28 November 2025 |
54.22 (-12.55%) |
59.88 |
51.51 - 65.66 |
0.7123 times |
Fri 31 October 2025 |
62.00 (-6.61%) |
66.48 |
61.03 - 76.52 |
1.1926 times |
Tue 30 September 2025 |
66.39 (25.24%) |
52.24 |
50.26 - 75.77 |
1.4767 times |
Fri 29 August 2025 |
53.01 (-9.03%) |
58.20 |
52.83 - 70.57 |
1.1133 times |
Thu 31 July 2025 |
58.27 (16.17%) |
50.05 |
49.76 - 68.45 |
1.2181 times |
Mon 30 June 2025 |
50.16 (-9.38%) |
54.90 |
49.15 - 64.97 |
1.2876 times |
Fri 30 May 2025 |
55.35 (27.3%) |
43.71 |
42.11 - 55.50 |
1.0295 times |
Wed 30 April 2025 |
43.48 (-7.84%) |
47.11 |
40.05 - 51.00 |
1.0208 times |
Mon 31 March 2025 |
47.18 (-7.83%) |
51.39 |
43.43 - 52.23 |
0.8167 times |
Fri 28 February 2025 |
51.19 (-6.77%) |
57.00 |
49.22 - 58.24 |
0.7894 times |
DMA SMA EMA moving averages of Etsy Inc ETSY
DMA (daily moving average) of Etsy Inc ETSY
| DMA period | DMA value | | 5 day DMA | 53.94 | | 12 day DMA | 53.52 | | 20 day DMA | 55.81 | | 35 day DMA | 61.18 | | 50 day DMA | 64.19 | | 100 day DMA | 62.5 | | 150 day DMA | 59.73 | | 200 day DMA | 56.17 | EMA (exponential moving average) of Etsy Inc ETSY
| EMA period | EMA current | EMA prev | EMA prev2 | | 5 day EMA | 53.52 | 54.18 | 54.36 | | 12 day EMA | 54.53 | 54.96 | 55.16 | | 20 day EMA | 56.32 | 56.76 | 57.07 | | 35 day EMA | 59.68 | 60.12 | 60.49 | | 50 day EMA | 63.47 | 63.93 | 64.34 |
SMA (simple moving average) of Etsy Inc ETSY
| SMA period | SMA current | SMA prev | SMA prev2 | | 5 day SMA | 53.94 | 54.34 | 54.37 | | 12 day SMA | 53.52 | 53.72 | 53.99 | | 20 day SMA | 55.81 | 56.21 | 56.43 | | 35 day SMA | 61.18 | 61.73 | 62.24 | | 50 day SMA | 64.19 | 64.55 | 64.8 | | 100 day SMA | 62.5 | 62.61 | 62.68 | | 150 day SMA | 59.73 | 59.69 | 59.63 | | 200 day SMA | 56.17 | 56.17 | 56.16 |
|
|
