EsperionTherapeutics ESPR full analysis,charts,indicators,moving averages,SMA,DMA,EMA,ADX,MACD,RSIEsperion Therapeutics ESPR WideScreen charts, DMA,SMA,EMA technical analysis, forecast prediction, by indicators ADX,MACD,RSI,CCI USA stock exchange
operates under Health Care sector & deals in Major Pharmaceuticals
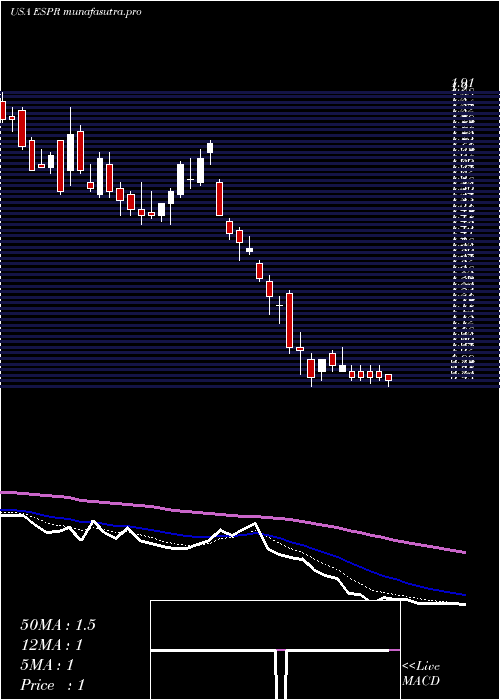
Daily price and charts and targets EsperionTherapeutics Strong Daily Stock price targets for EsperionTherapeutics ESPR are 3.7 and 3.85 | Daily Target 1 | 3.67 | | Daily Target 2 | 3.72 | | Daily Target 3 | 3.8166666666667 | | Daily Target 4 | 3.87 | | Daily Target 5 | 3.97 |
Daily price and volume Esperion Therapeutics
| Date |
Closing |
Open |
Range |
Volume |
Thu 04 December 2025 |
3.78 (0%) |
3.82 |
3.76 - 3.91 |
0.5752 times |
Wed 03 December 2025 |
3.78 (3%) |
3.66 |
3.61 - 3.85 |
0.554 times |
Tue 02 December 2025 |
3.67 (-1.34%) |
3.77 |
3.59 - 3.90 |
0.662 times |
Mon 01 December 2025 |
3.72 (-7.23%) |
3.94 |
3.64 - 4.03 |
0.9359 times |
Fri 28 November 2025 |
4.01 (1.52%) |
3.98 |
3.88 - 4.02 |
0.6166 times |
Wed 26 November 2025 |
3.95 (7.34%) |
3.72 |
3.64 - 4.02 |
1.388 times |
Tue 25 November 2025 |
3.68 (15.72%) |
3.23 |
3.20 - 3.77 |
2.4289 times |
Mon 24 November 2025 |
3.18 (3.25%) |
3.09 |
3.04 - 3.20 |
0.6674 times |
Fri 21 November 2025 |
3.08 (4.41%) |
2.95 |
2.95 - 3.18 |
1.3139 times |
Thu 20 November 2025 |
2.95 (5.73%) |
2.84 |
2.82 - 3.02 |
0.8581 times |
Wed 19 November 2025 |
2.79 (-1.41%) |
2.83 |
2.74 - 2.84 |
0.3665 times |
Weekly price and charts EsperionTherapeutics Strong weekly Stock price targets for EsperionTherapeutics ESPR are 3.47 and 3.91 | Weekly Target 1 | 3.36 | | Weekly Target 2 | 3.57 | | Weekly Target 3 | 3.8 | | Weekly Target 4 | 4.01 | | Weekly Target 5 | 4.24 |
Weekly price and volumes for Esperion Therapeutics
| Date |
Closing |
Open |
Range |
Volume |
Thu 04 December 2025 |
3.78 (-5.74%) |
3.94 |
3.59 - 4.03 |
0.6841 times |
Fri 28 November 2025 |
4.01 (30.19%) |
3.09 |
3.04 - 4.02 |
1.2795 times |
Fri 21 November 2025 |
3.08 (6.21%) |
2.88 |
2.66 - 3.18 |
0.9866 times |
Fri 14 November 2025 |
2.90 (9.02%) |
2.68 |
2.65 - 3.26 |
1.2052 times |
Fri 07 November 2025 |
2.66 (-10.44%) |
2.90 |
2.42 - 3.00 |
0.9373 times |
Fri 31 October 2025 |
2.97 (0%) |
2.84 |
2.80 - 3.01 |
0.2108 times |
Fri 31 October 2025 |
2.97 (9.59%) |
2.75 |
2.73 - 3.11 |
0.9812 times |
Fri 24 October 2025 |
2.71 (-1.09%) |
2.78 |
2.65 - 2.85 |
0.6095 times |
Fri 17 October 2025 |
2.74 (8.3%) |
2.55 |
2.50 - 2.84 |
1.0599 times |
Fri 10 October 2025 |
2.53 (-22.87%) |
3.29 |
2.30 - 3.42 |
2.046 times |
Fri 03 October 2025 |
3.28 (23.77%) |
2.69 |
2.57 - 3.38 |
1.4886 times |

Monthly price and charts EsperionTherapeutics Strong monthly Stock price targets for EsperionTherapeutics ESPR are 3.47 and 3.91 | Monthly Target 1 | 3.36 | | Monthly Target 2 | 3.57 | | Monthly Target 3 | 3.8 | | Monthly Target 4 | 4.01 | | Monthly Target 5 | 4.24 |
Monthly price and volumes Esperion Therapeutics
| Date |
Closing |
Open |
Range |
Volume |
Thu 04 December 2025 |
3.78 (-5.74%) |
3.94 |
3.59 - 4.03 |
0.1855 times |
Fri 28 November 2025 |
4.01 (35.02%) |
2.90 |
2.42 - 4.02 |
1.1956 times |
Fri 31 October 2025 |
2.97 (12.08%) |
2.63 |
2.30 - 3.42 |
1.6129 times |
Tue 30 September 2025 |
2.65 (19.37%) |
2.22 |
2.20 - 2.94 |
1.3435 times |
Fri 29 August 2025 |
2.22 (56.34%) |
1.39 |
1.34 - 2.29 |
1.0437 times |
Thu 31 July 2025 |
1.42 (44.9%) |
0.96 |
0.95 - 2.08 |
0.9985 times |
Mon 30 June 2025 |
0.98 (15.29%) |
0.85 |
0.85 - 1.27 |
0.6143 times |
Fri 30 May 2025 |
0.85 (-15%) |
1.01 |
0.69 - 1.11 |
1.1636 times |
Wed 30 April 2025 |
1.00 (-30.56%) |
1.45 |
0.82 - 1.46 |
1.062 times |
Mon 31 March 2025 |
1.44 (-15.29%) |
1.75 |
1.42 - 1.86 |
0.7804 times |
Fri 28 February 2025 |
1.70 (-5.03%) |
1.75 |
1.64 - 1.94 |
0.4714 times |

DMA SMA EMA moving averages of Esperion Therapeutics ESPR
DMA (daily moving average) of Esperion Therapeutics ESPR
| DMA period | DMA value | | 5 day DMA | 3.79 | | 12 day DMA | 3.45 | | 20 day DMA | 3.21 | | 35 day DMA | 3.05 | | 50 day DMA | 2.96 | | 100 day DMA | 2.5 | | 150 day DMA | 2.01 | | 200 day DMA | 1.85 | EMA (exponential moving average) of Esperion Therapeutics ESPR
| EMA period | EMA current | EMA prev | EMA prev2 | | 5 day EMA | 3.73 | 3.71 | 3.68 | | 12 day EMA | 3.53 | 3.48 | 3.42 | | 20 day EMA | 3.35 | 3.3 | 3.25 | | 35 day EMA | 3.17 | 3.13 | 3.09 | | 50 day EMA | 3.01 | 2.98 | 2.95 |
SMA (simple moving average) of Esperion Therapeutics ESPR
| SMA period | SMA current | SMA prev | SMA prev2 | | 5 day SMA | 3.79 | 3.83 | 3.81 | | 12 day SMA | 3.45 | 3.37 | 3.3 | | 20 day SMA | 3.21 | 3.17 | 3.13 | | 35 day SMA | 3.05 | 3.01 | 2.98 | | 50 day SMA | 2.96 | 2.93 | 2.91 | | 100 day SMA | 2.5 | 2.48 | 2.45 | | 150 day SMA | 2.01 | 1.99 | 1.97 | | 200 day SMA | 1.85 | 1.84 | 1.83 |
|
|
