EversourceEnergy ES full analysis,charts,indicators,moving averages,SMA,DMA,EMA,ADX,MACD,RSIEversource Energy ES WideScreen charts, DMA,SMA,EMA technical analysis, forecast prediction, by indicators ADX,MACD,RSI,CCI USA stock exchange
operates under Public Utilities sector & deals in Electric Utilities Central
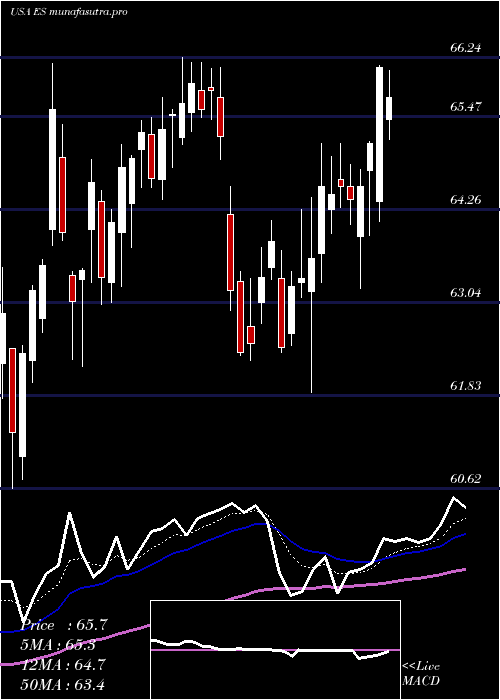
Daily price and charts and targets EversourceEnergy Strong Daily Stock price targets for EversourceEnergy ES are 71.89 and 73.11 | Daily Target 1 | 71.56 | | Daily Target 2 | 72.21 | | Daily Target 3 | 72.783333333333 | | Daily Target 4 | 73.43 | | Daily Target 5 | 74 |
Daily price and volume Eversource Energy
| Date |
Closing |
Open |
Range |
Volume |
Mon 20 October 2025 |
72.85 (0.4%) |
73.05 |
72.14 - 73.36 |
0.9422 times |
Fri 17 October 2025 |
72.56 (1.68%) |
71.90 |
71.52 - 72.57 |
1.1428 times |
Thu 16 October 2025 |
71.36 (-1.22%) |
72.14 |
71.19 - 72.67 |
0.8505 times |
Wed 15 October 2025 |
72.24 (2.34%) |
71.10 |
70.71 - 72.48 |
0.8417 times |
Tue 14 October 2025 |
70.59 (-0.54%) |
70.80 |
70.34 - 71.30 |
1.2004 times |
Mon 13 October 2025 |
70.97 (-1.91%) |
71.55 |
70.60 - 72.08 |
1.1939 times |
Fri 10 October 2025 |
72.35 (-0.06%) |
72.74 |
71.92 - 72.82 |
0.5864 times |
Thu 09 October 2025 |
72.39 (-1.5%) |
73.50 |
72.33 - 73.51 |
0.7117 times |
Wed 08 October 2025 |
73.49 (0.89%) |
73.13 |
72.64 - 74.46 |
1.1721 times |
Tue 07 October 2025 |
72.84 (0.19%) |
72.91 |
72.01 - 73.07 |
1.3584 times |
Mon 06 October 2025 |
72.70 (0.23%) |
72.82 |
72.50 - 73.23 |
0.7817 times |
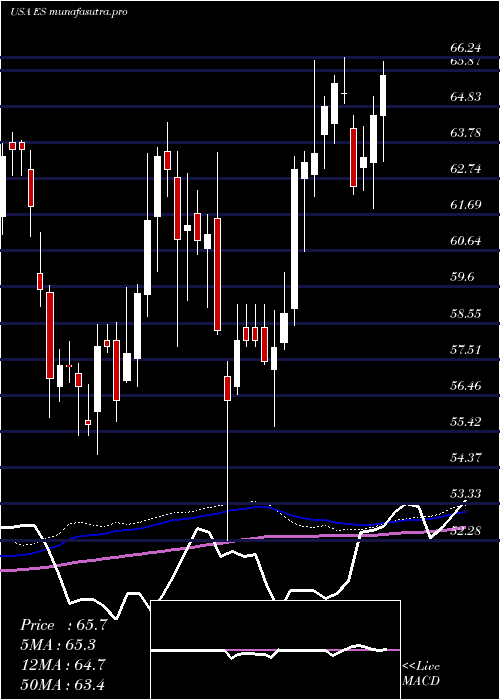
Weekly price and charts EversourceEnergy Strong weekly Stock price targets for EversourceEnergy ES are 71.89 and 73.11 | Weekly Target 1 | 71.56 | | Weekly Target 2 | 72.21 | | Weekly Target 3 | 72.783333333333 | | Weekly Target 4 | 73.43 | | Weekly Target 5 | 74 |
Weekly price and volumes for Eversource Energy
| Date |
Closing |
Open |
Range |
Volume |
Mon 20 October 2025 |
72.85 (0.4%) |
73.05 |
72.14 - 73.36 |
0.1846 times |
Fri 17 October 2025 |
72.56 (0.29%) |
71.55 |
70.34 - 72.67 |
1.0246 times |
Fri 10 October 2025 |
72.35 (-0.25%) |
72.82 |
71.92 - 74.46 |
0.9033 times |
Fri 03 October 2025 |
72.53 (3.96%) |
69.85 |
69.47 - 73.48 |
1.0503 times |
Fri 26 September 2025 |
69.77 (4.13%) |
66.00 |
65.40 - 69.97 |
1.6361 times |
Fri 19 September 2025 |
67.00 (1.98%) |
65.80 |
62.89 - 69.47 |
1.9956 times |
Fri 12 September 2025 |
65.70 (3.42%) |
63.47 |
62.45 - 65.83 |
1.0839 times |
Fri 05 September 2025 |
63.53 (-0.84%) |
63.75 |
62.77 - 64.14 |
0.6075 times |
Fri 29 August 2025 |
64.07 (0%) |
64.30 |
63.96 - 64.75 |
0.1371 times |
Fri 29 August 2025 |
64.07 (-3.7%) |
63.50 |
61.53 - 64.97 |
1.3771 times |
Fri 22 August 2025 |
66.53 (1.53%) |
65.68 |
64.39 - 67.15 |
0.6408 times |
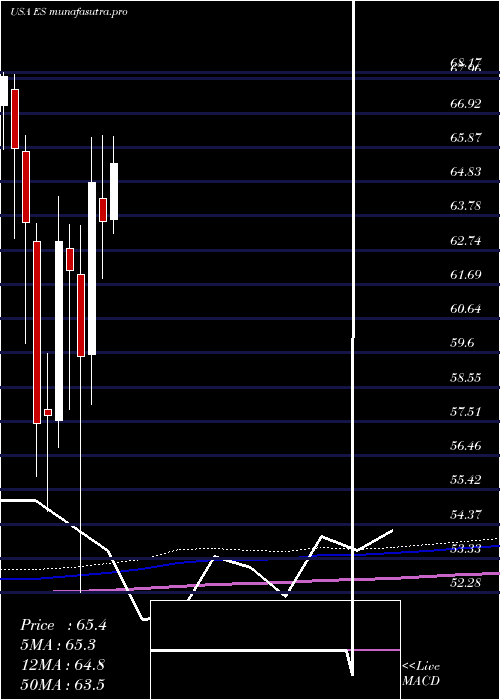
Monthly price and charts EversourceEnergy Strong monthly Stock price targets for EversourceEnergy ES are 71.6 and 75.72 | Monthly Target 1 | 68.43 | | Monthly Target 2 | 70.64 | | Monthly Target 3 | 72.55 | | Monthly Target 4 | 74.76 | | Monthly Target 5 | 76.67 |
Monthly price and volumes Eversource Energy
| Date |
Closing |
Open |
Range |
Volume |
Mon 20 October 2025 |
72.85 (2.4%) |
71.62 |
70.34 - 74.46 |
0.6428 times |
Tue 30 September 2025 |
71.14 (11.03%) |
63.75 |
62.45 - 71.17 |
1.3305 times |
Fri 29 August 2025 |
64.07 (-3.07%) |
66.58 |
61.53 - 67.15 |
0.8702 times |
Thu 31 July 2025 |
66.10 (3.9%) |
63.68 |
63.23 - 66.88 |
0.8025 times |
Mon 30 June 2025 |
63.62 (-1.84%) |
64.33 |
61.88 - 66.24 |
0.9489 times |
Fri 30 May 2025 |
64.81 (8.96%) |
59.54 |
58.03 - 66.16 |
1.0417 times |
Wed 30 April 2025 |
59.48 (-4.23%) |
62.00 |
52.28 - 63.50 |
1.1992 times |
Mon 31 March 2025 |
62.11 (-1.43%) |
62.77 |
57.87 - 63.53 |
0.8473 times |
Fri 28 February 2025 |
63.01 (9.24%) |
57.53 |
56.71 - 64.37 |
1.1215 times |
Fri 31 January 2025 |
57.68 (0.44%) |
57.87 |
54.75 - 59.59 |
1.1954 times |
Tue 31 December 2024 |
57.43 (-9.67%) |
63.00 |
55.82 - 63.55 |
0.6412 times |
DMA SMA EMA moving averages of Eversource Energy ES
DMA (daily moving average) of Eversource Energy ES
| DMA period | DMA value | | 5 day DMA | 71.92 | | 12 day DMA | 72.24 | | 20 day DMA | 71.44 | | 35 day DMA | 68.43 | | 50 day DMA | 67.42 | | 100 day DMA | 66.18 | | 150 day DMA | 64.19 | | 200 day DMA | 62.97 | EMA (exponential moving average) of Eversource Energy ES
| EMA period | EMA current | EMA prev | EMA prev2 | | 5 day EMA | 72.24 | 71.94 | 71.63 | | 12 day EMA | 71.76 | 71.56 | 71.38 | | 20 day EMA | 70.91 | 70.71 | 70.51 | | 35 day EMA | 69.52 | 69.32 | 69.13 | | 50 day EMA | 67.73 | 67.52 | 67.31 |
SMA (simple moving average) of Eversource Energy ES
| SMA period | SMA current | SMA prev | SMA prev2 | | 5 day SMA | 71.92 | 71.54 | 71.5 | | 12 day SMA | 72.24 | 72.15 | 72.07 | | 20 day SMA | 71.44 | 71.18 | 70.9 | | 35 day SMA | 68.43 | 68.18 | 67.93 | | 50 day SMA | 67.42 | 67.27 | 67.12 | | 100 day SMA | 66.18 | 66.1 | 66.01 | | 150 day SMA | 64.19 | 64.11 | 64.03 | | 200 day SMA | 62.97 | 62.89 | 62.82 |
|
|
