EqtCorporation EQT full analysis,charts,indicators,moving averages,SMA,DMA,EMA,ADX,MACD,RSIEqt Corporation EQT WideScreen charts, DMA,SMA,EMA technical analysis, forecast prediction, by indicators ADX,MACD,RSI,CCI USA stock exchange
operates under Energy sector & deals in Oil Gas Production
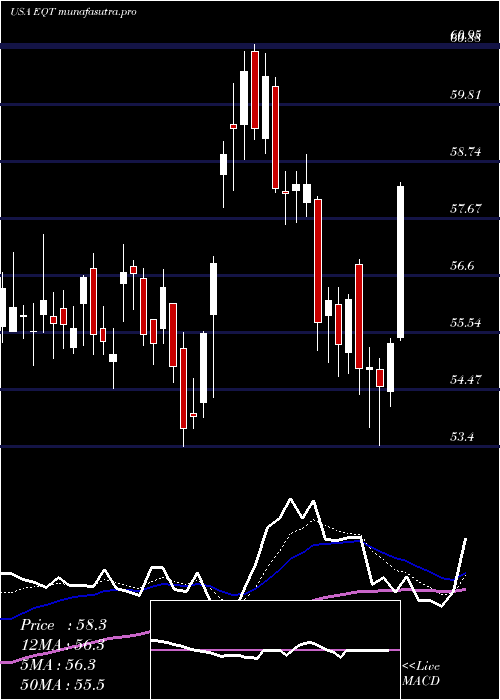
Daily price and charts and targets EqtCorporation Strong Daily Stock price targets for EqtCorporation EQT are 55.79 and 57.72 | Daily Target 1 | 54.28 | | Daily Target 2 | 55.36 | | Daily Target 3 | 56.206666666667 | | Daily Target 4 | 57.29 | | Daily Target 5 | 58.14 |
Daily price and volume Eqt Corporation
| Date |
Closing |
Open |
Range |
Volume |
Mon 20 October 2025 |
56.45 (4.38%) |
55.35 |
55.12 - 57.05 |
0.8831 times |
Fri 17 October 2025 |
54.08 (1.58%) |
53.49 |
52.55 - 54.53 |
0.8185 times |
Thu 16 October 2025 |
53.24 (-3.97%) |
55.63 |
52.79 - 56.23 |
1.2199 times |
Wed 15 October 2025 |
55.44 (4.03%) |
53.94 |
53.75 - 55.53 |
0.8682 times |
Tue 14 October 2025 |
53.29 (-0.69%) |
52.74 |
51.66 - 53.83 |
0.8522 times |
Mon 13 October 2025 |
53.66 (-6.12%) |
53.22 |
52.76 - 53.84 |
0.5598 times |
Tue 07 October 2025 |
57.16 (-0.05%) |
57.09 |
56.31 - 57.55 |
1.3204 times |
Mon 06 October 2025 |
57.19 (2.07%) |
56.52 |
55.52 - 57.39 |
0.9004 times |
Fri 03 October 2025 |
56.03 (0.48%) |
55.60 |
55.04 - 56.48 |
1.1883 times |
Thu 02 October 2025 |
55.76 (-0.71%) |
56.15 |
55.04 - 57.35 |
1.3893 times |
Wed 01 October 2025 |
56.16 (3.18%) |
54.25 |
54.01 - 57.08 |
1.8937 times |
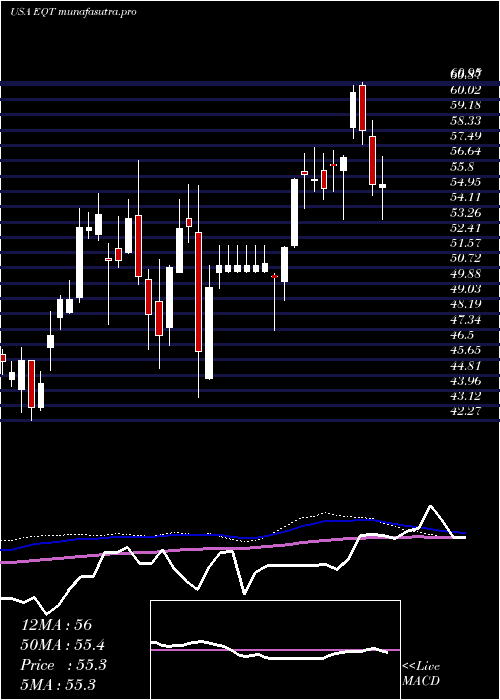
Weekly price and charts EqtCorporation Strong weekly Stock price targets for EqtCorporation EQT are 55.79 and 57.72 | Weekly Target 1 | 54.28 | | Weekly Target 2 | 55.36 | | Weekly Target 3 | 56.206666666667 | | Weekly Target 4 | 57.29 | | Weekly Target 5 | 58.14 |
Weekly price and volumes for Eqt Corporation
| Date |
Closing |
Open |
Range |
Volume |
Mon 20 October 2025 |
56.45 (4.38%) |
55.35 |
55.12 - 57.05 |
0.1848 times |
Fri 17 October 2025 |
54.08 (-5.39%) |
53.22 |
51.66 - 56.23 |
0.9039 times |
Tue 07 October 2025 |
57.16 (2.02%) |
56.52 |
55.52 - 57.55 |
0.4648 times |
Fri 03 October 2025 |
56.03 (3.64%) |
53.96 |
53.61 - 57.35 |
1.6754 times |
Fri 26 September 2025 |
54.06 (9.9%) |
49.02 |
48.60 - 54.96 |
1.7194 times |
Fri 19 September 2025 |
49.19 (-3.44%) |
50.81 |
48.47 - 51.06 |
2.0081 times |
Fri 12 September 2025 |
50.94 (-1.28%) |
52.39 |
50.04 - 52.56 |
0.8879 times |
Fri 05 September 2025 |
51.60 (-0.46%) |
51.20 |
50.51 - 53.00 |
0.7716 times |
Fri 29 August 2025 |
51.84 (0%) |
52.21 |
51.67 - 52.47 |
0.2071 times |
Fri 29 August 2025 |
51.84 (-0.25%) |
51.76 |
50.80 - 53.17 |
1.1768 times |
Fri 22 August 2025 |
51.97 (-1.67%) |
51.07 |
49.40 - 52.84 |
1.034 times |
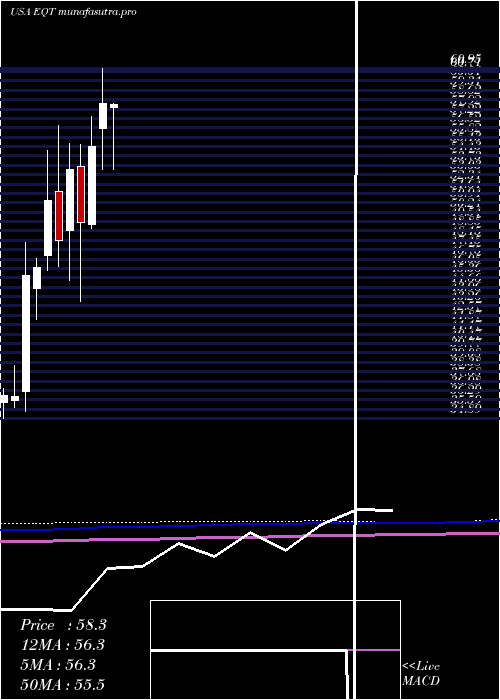
Monthly price and charts EqtCorporation Strong monthly Stock price targets for EqtCorporation EQT are 54.06 and 59.95 | Monthly Target 1 | 49.33 | | Monthly Target 2 | 52.89 | | Monthly Target 3 | 55.22 | | Monthly Target 4 | 58.78 | | Monthly Target 5 | 61.11 |
Monthly price and volumes Eqt Corporation
| Date |
Closing |
Open |
Range |
Volume |
Mon 20 October 2025 |
56.45 (3.71%) |
54.25 |
51.66 - 57.55 |
0.4728 times |
Tue 30 September 2025 |
54.43 (5%) |
51.20 |
48.47 - 55.31 |
1.1635 times |
Fri 29 August 2025 |
51.84 (-3.55%) |
53.08 |
49.40 - 53.38 |
0.8543 times |
Thu 31 July 2025 |
53.75 (-7.84%) |
58.03 |
51.07 - 60.31 |
1.3825 times |
Mon 30 June 2025 |
58.32 (5.79%) |
56.45 |
53.40 - 60.95 |
0.8688 times |
Fri 30 May 2025 |
55.13 (11.51%) |
49.31 |
49.06 - 57.37 |
0.9234 times |
Wed 30 April 2025 |
49.44 (-7.47%) |
53.67 |
43.57 - 55.25 |
1.2232 times |
Mon 31 March 2025 |
53.43 (10.92%) |
48.85 |
45.18 - 55.34 |
0.9221 times |
Fri 28 February 2025 |
48.17 (-5.77%) |
51.81 |
46.20 - 56.66 |
1.0325 times |
Fri 31 January 2025 |
51.12 (10.87%) |
47.00 |
45.92 - 54.85 |
1.1569 times |
Tue 31 December 2024 |
46.11 (1.21%) |
44.58 |
42.27 - 46.76 |
0.636 times |
DMA SMA EMA moving averages of Eqt Corporation EQT
DMA (daily moving average) of Eqt Corporation EQT
| DMA period | DMA value | | 5 day DMA | 54.5 | | 12 day DMA | 55.24 | | 20 day DMA | 53.9 | | 35 day DMA | 52.72 | | 50 day DMA | 52.39 | | 100 day DMA | 54.11 | | 150 day DMA | 53.41 | | 200 day DMA | 52.71 | EMA (exponential moving average) of Eqt Corporation EQT
| EMA period | EMA current | EMA prev | EMA prev2 | | 5 day EMA | 55.01 | 54.29 | 54.39 | | 12 day EMA | 54.66 | 54.33 | 54.37 | | 20 day EMA | 54.1 | 53.85 | 53.83 | | 35 day EMA | 53.46 | 53.28 | 53.23 | | 50 day EMA | 52.62 | 52.46 | 52.39 |
SMA (simple moving average) of Eqt Corporation EQT
| SMA period | SMA current | SMA prev | SMA prev2 | | 5 day SMA | 54.5 | 53.94 | 54.56 | | 12 day SMA | 55.24 | 55.08 | 55.07 | | 20 day SMA | 53.9 | 53.57 | 53.37 | | 35 day SMA | 52.72 | 52.58 | 52.54 | | 50 day SMA | 52.39 | 52.29 | 52.24 | | 100 day SMA | 54.11 | 54.1 | 54.12 | | 150 day SMA | 53.41 | 53.36 | 53.32 | | 200 day SMA | 52.71 | 52.66 | 52.62 |
|
|
