EnovaInternational ENVA full analysis,charts,indicators,moving averages,SMA,DMA,EMA,ADX,MACD,RSIEnova International ENVA WideScreen charts, DMA,SMA,EMA technical analysis, forecast prediction, by indicators ADX,MACD,RSI,CCI USA stock exchange
operates under Finance sector & deals in Finance Consumer Services
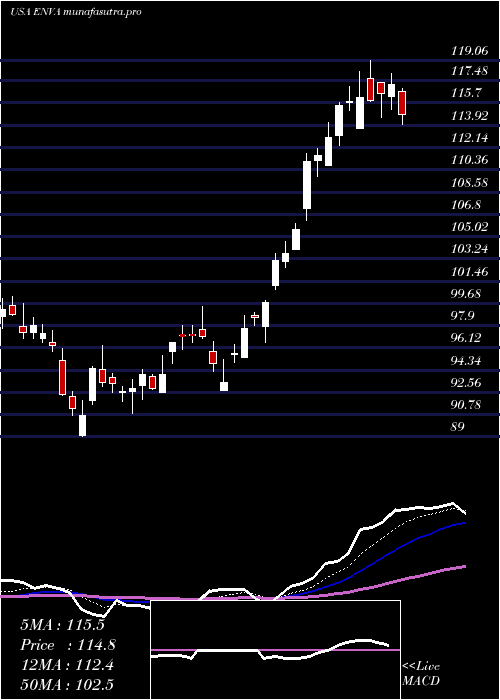
Daily price and charts and targets EnovaInternational Strong Daily Stock price targets for EnovaInternational ENVA are 135.28 and 137.29 | Daily Target 1 | 133.65 | | Daily Target 2 | 134.9 | | Daily Target 3 | 135.65666666667 | | Daily Target 4 | 136.91 | | Daily Target 5 | 137.67 |
Daily price and volume Enova International
| Date |
Closing |
Open |
Range |
Volume |
Thu 04 December 2025 |
136.16 (0.56%) |
135.06 |
134.40 - 136.41 |
1.2313 times |
Wed 03 December 2025 |
135.40 (3.45%) |
131.40 |
131.40 - 135.78 |
0.9908 times |
Tue 02 December 2025 |
130.89 (0.54%) |
131.60 |
129.55 - 131.60 |
0.8068 times |
Mon 01 December 2025 |
130.19 (-0.69%) |
130.47 |
129.28 - 132.15 |
0.8202 times |
Fri 28 November 2025 |
131.09 (0.36%) |
131.00 |
130.60 - 132.00 |
0.3181 times |
Wed 26 November 2025 |
130.62 (0.18%) |
129.92 |
129.92 - 132.60 |
1.4148 times |
Tue 25 November 2025 |
130.38 (3.36%) |
126.75 |
126.50 - 131.17 |
2.1358 times |
Mon 24 November 2025 |
126.14 (1.58%) |
124.18 |
123.51 - 126.57 |
0.5828 times |
Fri 21 November 2025 |
124.18 (3.14%) |
121.54 |
119.76 - 125.98 |
0.8264 times |
Thu 20 November 2025 |
120.40 (-0.96%) |
123.00 |
119.77 - 125.58 |
0.8731 times |
Wed 19 November 2025 |
121.57 (1.74%) |
119.66 |
119.02 - 121.65 |
0.6835 times |
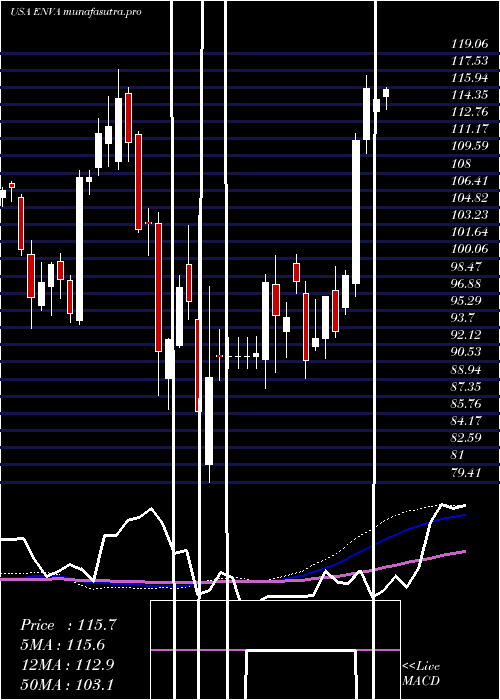
Weekly price and charts EnovaInternational Strong weekly Stock price targets for EnovaInternational ENVA are 132.72 and 139.85 | Weekly Target 1 | 126.82 | | Weekly Target 2 | 131.49 | | Weekly Target 3 | 133.95 | | Weekly Target 4 | 138.62 | | Weekly Target 5 | 141.08 |
Weekly price and volumes for Enova International
| Date |
Closing |
Open |
Range |
Volume |
Thu 04 December 2025 |
136.16 (3.87%) |
130.47 |
129.28 - 136.41 |
0.7631 times |
Fri 28 November 2025 |
131.09 (5.56%) |
124.18 |
123.51 - 132.60 |
0.8825 times |
Fri 21 November 2025 |
124.18 (-1.2%) |
125.55 |
119.02 - 128.49 |
0.789 times |
Fri 14 November 2025 |
125.69 (0.66%) |
125.39 |
119.80 - 133.33 |
0.8854 times |
Fri 07 November 2025 |
124.86 (4.42%) |
121.58 |
120.18 - 130.46 |
1.0411 times |
Fri 31 October 2025 |
119.57 (0%) |
119.28 |
118.28 - 121.18 |
0.2546 times |
Fri 31 October 2025 |
119.57 (-4.11%) |
125.80 |
117.66 - 126.57 |
1.7236 times |
Fri 24 October 2025 |
124.70 (14.53%) |
109.70 |
108.72 - 127.82 |
1.5182 times |
Fri 17 October 2025 |
108.88 (4.68%) |
105.60 |
103.02 - 112.70 |
1.0506 times |
Fri 10 October 2025 |
104.01 (-8.17%) |
114.00 |
103.41 - 114.60 |
1.0919 times |
Fri 03 October 2025 |
113.26 (-7.11%) |
122.45 |
109.58 - 123.58 |
1.3142 times |
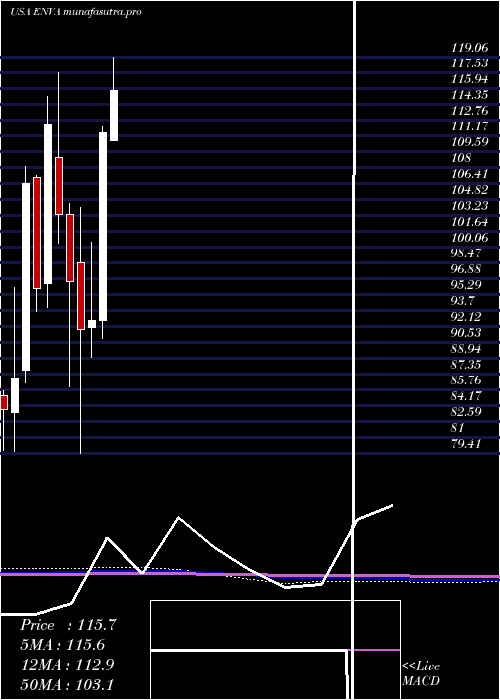
Monthly price and charts EnovaInternational Strong monthly Stock price targets for EnovaInternational ENVA are 132.72 and 139.85 | Monthly Target 1 | 126.82 | | Monthly Target 2 | 131.49 | | Monthly Target 3 | 133.95 | | Monthly Target 4 | 138.62 | | Monthly Target 5 | 141.08 |
Monthly price and volumes Enova International
| Date |
Closing |
Open |
Range |
Volume |
Thu 04 December 2025 |
136.16 (3.87%) |
130.47 |
129.28 - 136.41 |
0.1429 times |
Fri 28 November 2025 |
131.09 (9.63%) |
121.58 |
119.02 - 133.33 |
0.6737 times |
Fri 31 October 2025 |
119.57 (3.89%) |
113.88 |
103.02 - 127.82 |
1.1661 times |
Tue 30 September 2025 |
115.09 (-5.12%) |
119.33 |
113.49 - 130.34 |
1.2893 times |
Fri 29 August 2025 |
121.30 (16.01%) |
103.11 |
99.61 - 123.48 |
1.0282 times |
Thu 31 July 2025 |
104.56 (-6.24%) |
110.69 |
103.52 - 119.06 |
1.5113 times |
Mon 30 June 2025 |
111.52 (20.34%) |
92.67 |
90.87 - 112.09 |
1.1296 times |
Fri 30 May 2025 |
92.67 (0.96%) |
91.99 |
89.00 - 100.50 |
0.8583 times |
Wed 30 April 2025 |
91.79 (-4.94%) |
98.46 |
79.41 - 104.03 |
1.2657 times |
Mon 31 March 2025 |
96.56 (-6.56%) |
103.35 |
86.12 - 104.37 |
0.935 times |
Fri 28 February 2025 |
103.34 (-8%) |
109.04 |
100.39 - 117.56 |
0.9508 times |
DMA SMA EMA moving averages of Enova International ENVA
DMA (daily moving average) of Enova International ENVA
| DMA period | DMA value | | 5 day DMA | 132.75 | | 12 day DMA | 128.04 | | 20 day DMA | 127.09 | | 35 day DMA | 122.92 | | 50 day DMA | 119.82 | | 100 day DMA | 116.89 | | 150 day DMA | 111.37 | | 200 day DMA | 107.24 | EMA (exponential moving average) of Enova International ENVA
| EMA period | EMA current | EMA prev | EMA prev2 | | 5 day EMA | 133.15 | 131.64 | 129.76 | | 12 day EMA | 129.86 | 128.71 | 127.49 | | 20 day EMA | 127.56 | 126.66 | 125.74 | | 35 day EMA | 124.44 | 123.75 | 123.06 | | 50 day EMA | 121.63 | 121.04 | 120.45 |
SMA (simple moving average) of Enova International ENVA
| SMA period | SMA current | SMA prev | SMA prev2 | | 5 day SMA | 132.75 | 131.64 | 130.63 | | 12 day SMA | 128.04 | 126.76 | 125.95 | | 20 day SMA | 127.09 | 126.68 | 126.04 | | 35 day SMA | 122.92 | 122.22 | 121.51 | | 50 day SMA | 119.82 | 119.58 | 119.37 | | 100 day SMA | 116.89 | 116.65 | 116.46 | | 150 day SMA | 111.37 | 111.07 | 110.83 | | 200 day SMA | 107.24 | 107.11 | 106.98 |
|
|
