EmersonElectric EMR full analysis,charts,indicators,moving averages,SMA,DMA,EMA,ADX,MACD,RSIEmerson Electric EMR WideScreen charts, DMA,SMA,EMA technical analysis, forecast prediction, by indicators ADX,MACD,RSI,CCI USA stock exchange
operates under Energy sector & deals in Consumer Electronics Appliances
Daily price and charts and targets EmersonElectric Strong Daily Stock price targets for EmersonElectric EMR are 129.82 and 131.64 | Daily Target 1 | 128.43 | | Daily Target 2 | 129.39 | | Daily Target 3 | 130.25 | | Daily Target 4 | 131.21 | | Daily Target 5 | 132.07 |
Daily price and volume Emerson Electric
| Date |
Closing |
Open |
Range |
Volume |
Mon 20 October 2025 |
130.35 (0.83%) |
130.05 |
129.29 - 131.11 |
0.8339 times |
Fri 17 October 2025 |
129.28 (0.3%) |
128.40 |
128.01 - 129.85 |
0.9065 times |
Thu 16 October 2025 |
128.89 (-1.06%) |
130.94 |
128.44 - 131.45 |
1.1176 times |
Wed 15 October 2025 |
130.27 (0.39%) |
131.15 |
128.46 - 132.45 |
1.2119 times |
Tue 14 October 2025 |
129.77 (1.24%) |
126.00 |
125.72 - 131.32 |
0.911 times |
Mon 13 October 2025 |
128.18 (1.72%) |
128.58 |
127.66 - 129.73 |
0.9327 times |
Fri 10 October 2025 |
126.01 (-4.2%) |
132.10 |
125.89 - 132.40 |
1.2473 times |
Thu 09 October 2025 |
131.53 (-1.06%) |
133.45 |
130.82 - 134.23 |
0.851 times |
Wed 08 October 2025 |
132.94 (1.1%) |
132.22 |
130.85 - 134.04 |
0.7811 times |
Tue 07 October 2025 |
131.49 (-2.43%) |
135.77 |
130.89 - 135.77 |
1.207 times |
Mon 06 October 2025 |
134.77 (0.01%) |
134.77 |
132.15 - 135.49 |
0.6823 times |
Weekly price and charts EmersonElectric Strong weekly Stock price targets for EmersonElectric EMR are 129.82 and 131.64 | Weekly Target 1 | 128.43 | | Weekly Target 2 | 129.39 | | Weekly Target 3 | 130.25 | | Weekly Target 4 | 131.21 | | Weekly Target 5 | 132.07 |
Weekly price and volumes for Emerson Electric
| Date |
Closing |
Open |
Range |
Volume |
Mon 20 October 2025 |
130.35 (0.83%) |
130.05 |
129.29 - 131.11 |
0.1617 times |
Fri 17 October 2025 |
129.28 (2.6%) |
128.58 |
125.72 - 132.45 |
0.9848 times |
Fri 10 October 2025 |
126.01 (-6.49%) |
134.77 |
125.89 - 135.77 |
0.9245 times |
Fri 03 October 2025 |
134.76 (4.79%) |
129.52 |
128.52 - 135.80 |
1.1534 times |
Fri 26 September 2025 |
128.60 (-2.83%) |
132.47 |
126.55 - 134.00 |
1.6112 times |
Fri 19 September 2025 |
132.34 (-2.04%) |
136.01 |
128.00 - 136.62 |
1.7823 times |
Fri 12 September 2025 |
135.10 (1.92%) |
133.17 |
131.65 - 137.68 |
0.9575 times |
Fri 05 September 2025 |
132.55 (0.42%) |
130.27 |
128.64 - 134.47 |
0.9803 times |
Fri 29 August 2025 |
132.00 (0%) |
133.72 |
131.63 - 134.65 |
0.2091 times |
Fri 29 August 2025 |
132.00 (-1.32%) |
133.78 |
131.63 - 135.09 |
1.2352 times |
Fri 22 August 2025 |
133.77 (1.53%) |
131.03 |
129.90 - 134.54 |
1.1799 times |
Monthly price and charts EmersonElectric Strong monthly Stock price targets for EmersonElectric EMR are 128.04 and 138.12 | Monthly Target 1 | 120.54 | | Monthly Target 2 | 125.45 | | Monthly Target 3 | 130.62333333333 | | Monthly Target 4 | 135.53 | | Monthly Target 5 | 140.7 |
Monthly price and volumes Emerson Electric
| Date |
Closing |
Open |
Range |
Volume |
Mon 20 October 2025 |
130.35 (-0.63%) |
129.95 |
125.72 - 135.80 |
0.4844 times |
Tue 30 September 2025 |
131.18 (-0.62%) |
130.27 |
126.55 - 137.68 |
1.0882 times |
Fri 29 August 2025 |
132.00 (-9.28%) |
142.11 |
123.71 - 143.14 |
1.2367 times |
Thu 31 July 2025 |
145.51 (9.14%) |
132.94 |
132.60 - 150.27 |
1.0258 times |
Mon 30 June 2025 |
133.33 (11.69%) |
119.01 |
117.16 - 134.15 |
0.9434 times |
Fri 30 May 2025 |
119.38 (13.58%) |
105.64 |
104.52 - 122.62 |
1.0816 times |
Wed 30 April 2025 |
105.11 (-4.13%) |
109.35 |
90.06 - 111.99 |
1.1267 times |
Mon 31 March 2025 |
109.64 (-9.84%) |
122.84 |
106.50 - 123.03 |
1.1041 times |
Fri 28 February 2025 |
121.61 (-6.42%) |
126.87 |
118.23 - 129.95 |
0.8167 times |
Fri 31 January 2025 |
129.95 (4.86%) |
125.40 |
116.50 - 132.06 |
1.0924 times |
Tue 31 December 2024 |
123.93 (-6.82%) |
133.68 |
121.09 - 134.45 |
0.7925 times |

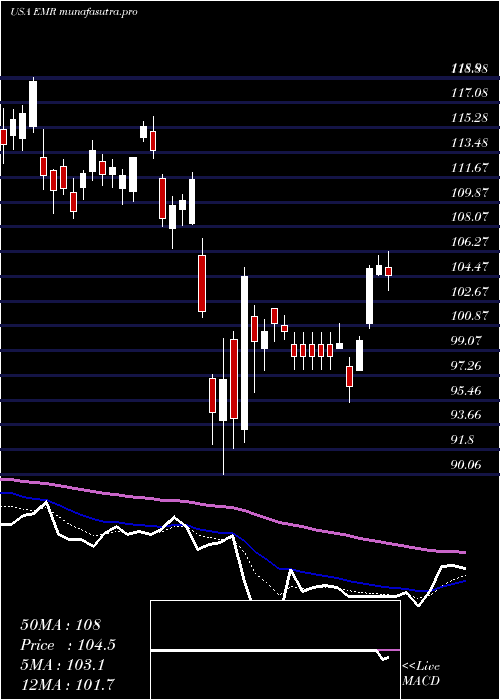
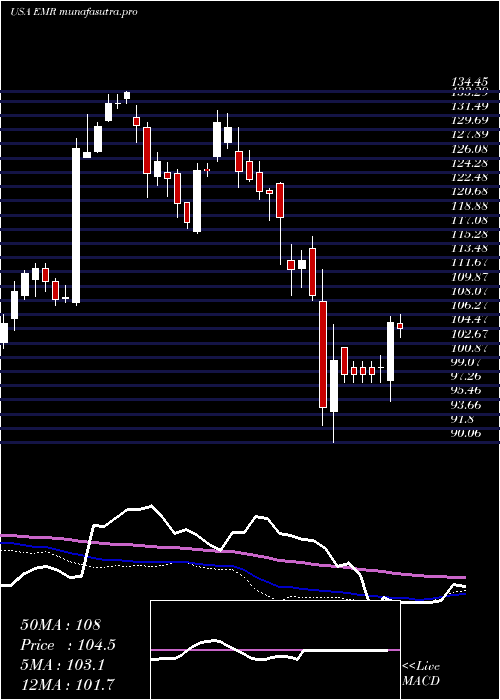
DMA SMA EMA moving averages of Emerson Electric EMR
DMA (daily moving average) of Emerson Electric EMR
| DMA period | DMA value | | 5 day DMA | 129.71 | | 12 day DMA | 130.69 | | 20 day DMA | 130.75 | | 35 day DMA | 131.58 | | 50 day DMA | 131.91 | | 100 day DMA | 133.18 | | 150 day DMA | 124.81 | | 200 day DMA | 124.15 | EMA (exponential moving average) of Emerson Electric EMR
| EMA period | EMA current | EMA prev | EMA prev2 | | 5 day EMA | 129.74 | 129.44 | 129.52 | | 12 day EMA | 130.18 | 130.15 | 130.31 | | 20 day EMA | 130.68 | 130.72 | 130.87 | | 35 day EMA | 131.3 | 131.36 | 131.48 | | 50 day EMA | 131.9 | 131.96 | 132.07 |
SMA (simple moving average) of Emerson Electric EMR
| SMA period | SMA current | SMA prev | SMA prev2 | | 5 day SMA | 129.71 | 129.28 | 128.62 | | 12 day SMA | 130.69 | 130.91 | 131.07 | | 20 day SMA | 130.75 | 130.87 | 131.03 | | 35 day SMA | 131.58 | 131.63 | 131.71 | | 50 day SMA | 131.91 | 131.94 | 132.01 | | 100 day SMA | 133.18 | 133.09 | 132.98 | | 150 day SMA | 124.81 | 124.7 | 124.59 | | 200 day SMA | 124.15 | 124.12 | 124.08 |
|
|
