TempletonEmerging EMF full analysis,charts,indicators,moving averages,SMA,DMA,EMA,ADX,MACD,RSITempleton Emerging EMF WideScreen charts, DMA,SMA,EMA technical analysis, forecast prediction, by indicators ADX,MACD,RSI,CCI USA stock exchange
operates under N A sector & deals in N A
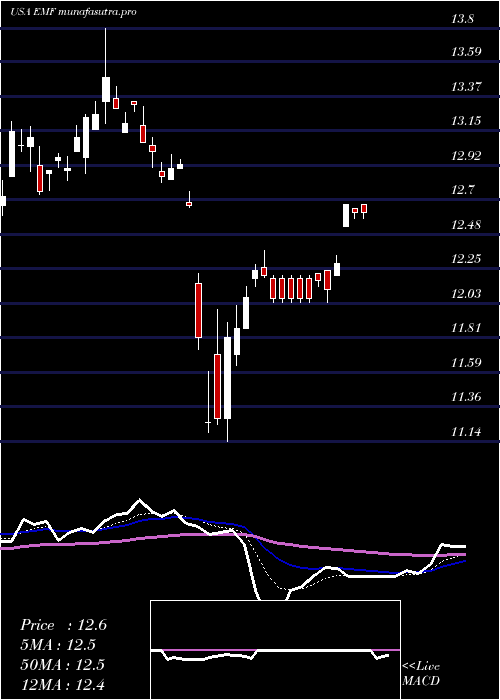
Daily price and charts and targets TempletonEmerging Strong Daily Stock price targets for TempletonEmerging EMF are 17.11 and 17.31 | Daily Target 1 | 16.96 | | Daily Target 2 | 17.05 | | Daily Target 3 | 17.156666666667 | | Daily Target 4 | 17.25 | | Daily Target 5 | 17.36 |
Daily price and volume Templeton Emerging
| Date |
Closing |
Open |
Range |
Volume |
Thu 04 December 2025 |
17.15 (0.53%) |
17.07 |
17.06 - 17.26 |
1.3233 times |
Wed 03 December 2025 |
17.06 (0.12%) |
17.03 |
16.94 - 17.16 |
1.6446 times |
Tue 02 December 2025 |
17.04 (0.24%) |
17.06 |
16.90 - 17.06 |
1.2854 times |
Mon 01 December 2025 |
17.00 (1.01%) |
16.83 |
16.83 - 17.04 |
0.6002 times |
Fri 28 November 2025 |
16.83 (-0.06%) |
16.81 |
16.75 - 17.00 |
0.2127 times |
Wed 26 November 2025 |
16.84 (1.45%) |
16.67 |
16.67 - 16.84 |
0.6853 times |
Tue 25 November 2025 |
16.60 (0.61%) |
16.43 |
16.43 - 16.64 |
0.8743 times |
Mon 24 November 2025 |
16.50 (-0.36%) |
16.54 |
16.43 - 16.60 |
1.7344 times |
Fri 21 November 2025 |
16.56 (-0.42%) |
16.39 |
16.17 - 16.59 |
0.7609 times |
Thu 20 November 2025 |
16.63 (-0.83%) |
16.83 |
16.62 - 16.95 |
0.879 times |
Wed 19 November 2025 |
16.77 (0.06%) |
16.76 |
16.72 - 16.87 |
0.6427 times |
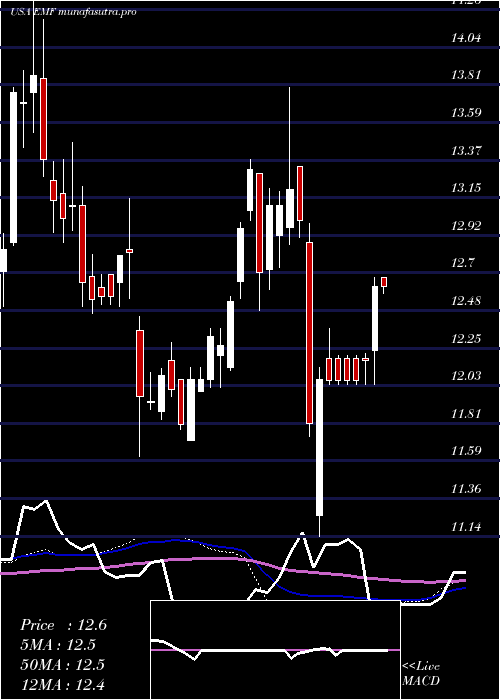
Weekly price and charts TempletonEmerging Strong weekly Stock price targets for TempletonEmerging EMF are 16.99 and 17.42 | Weekly Target 1 | 16.65 | | Weekly Target 2 | 16.9 | | Weekly Target 3 | 17.08 | | Weekly Target 4 | 17.33 | | Weekly Target 5 | 17.51 |
Weekly price and volumes for Templeton Emerging
| Date |
Closing |
Open |
Range |
Volume |
Thu 04 December 2025 |
17.15 (1.9%) |
16.83 |
16.83 - 17.26 |
0.9356 times |
Fri 28 November 2025 |
16.83 (1.63%) |
16.54 |
16.43 - 17.00 |
0.676 times |
Fri 21 November 2025 |
16.56 (-3.78%) |
17.14 |
16.17 - 17.19 |
1.6699 times |
Fri 14 November 2025 |
17.21 (-1.43%) |
17.81 |
17.21 - 17.91 |
1.5441 times |
Fri 07 November 2025 |
17.46 (-0.57%) |
17.50 |
17.43 - 17.77 |
0.809 times |
Fri 31 October 2025 |
17.56 (0%) |
17.77 |
17.56 - 17.79 |
0.1959 times |
Fri 31 October 2025 |
17.56 (2.27%) |
17.35 |
17.16 - 18.01 |
1.0832 times |
Fri 24 October 2025 |
17.17 (2.2%) |
16.86 |
16.82 - 17.22 |
0.665 times |
Fri 17 October 2025 |
16.80 (-1.52%) |
16.82 |
16.07 - 17.05 |
2.1208 times |
Tue 07 October 2025 |
17.06 (1.13%) |
16.92 |
16.84 - 17.29 |
0.3006 times |
Fri 03 October 2025 |
16.87 (3.69%) |
16.39 |
16.24 - 17.00 |
0.9539 times |
Monthly price and charts TempletonEmerging Strong monthly Stock price targets for TempletonEmerging EMF are 16.99 and 17.42 | Monthly Target 1 | 16.65 | | Monthly Target 2 | 16.9 | | Monthly Target 3 | 17.08 | | Monthly Target 4 | 17.33 | | Monthly Target 5 | 17.51 |
Monthly price and volumes Templeton Emerging
| Date |
Closing |
Open |
Range |
Volume |
Thu 04 December 2025 |
17.15 (1.9%) |
16.83 |
16.83 - 17.26 |
0.2052 times |
Fri 28 November 2025 |
16.83 (-4.16%) |
17.50 |
16.17 - 17.91 |
1.0307 times |
Fri 31 October 2025 |
17.56 (4.9%) |
16.74 |
16.07 - 18.01 |
1.0339 times |
Tue 30 September 2025 |
16.74 (9.63%) |
15.49 |
15.08 - 16.98 |
0.5949 times |
Fri 29 August 2025 |
15.27 (2%) |
14.90 |
14.83 - 15.66 |
0.4764 times |
Thu 31 July 2025 |
14.97 (2.6%) |
14.57 |
14.36 - 15.13 |
1.2825 times |
Mon 30 June 2025 |
14.59 (8.07%) |
13.45 |
13.44 - 14.61 |
0.4677 times |
Fri 30 May 2025 |
13.50 (6.47%) |
12.72 |
12.68 - 13.69 |
0.6934 times |
Wed 30 April 2025 |
12.68 (-1.32%) |
12.83 |
11.14 - 12.99 |
1.104 times |
Mon 31 March 2025 |
12.85 (1.18%) |
12.72 |
12.60 - 13.80 |
3.1112 times |
Fri 28 February 2025 |
12.70 (3.5%) |
12.14 |
12.12 - 13.37 |
1.0581 times |

DMA SMA EMA moving averages of Templeton Emerging EMF
DMA (daily moving average) of Templeton Emerging EMF
| DMA period | DMA value | | 5 day DMA | 17.02 | | 12 day DMA | 16.81 | | 20 day DMA | 17.08 | | 35 day DMA | 17.18 | | 50 day DMA | 17.01 | | 100 day DMA | 16.19 | | 150 day DMA | 15.38 | | 200 day DMA | 14.7 | EMA (exponential moving average) of Templeton Emerging EMF
| EMA period | EMA current | EMA prev | EMA prev2 | | 5 day EMA | 17.02 | 16.95 | 16.9 | | 12 day EMA | 16.97 | 16.94 | 16.92 | | 20 day EMA | 17.01 | 17 | 16.99 | | 35 day EMA | 16.97 | 16.96 | 16.95 | | 50 day EMA | 16.96 | 16.95 | 16.95 |
SMA (simple moving average) of Templeton Emerging EMF
| SMA period | SMA current | SMA prev | SMA prev2 | | 5 day SMA | 17.02 | 16.95 | 16.86 | | 12 day SMA | 16.81 | 16.79 | 16.81 | | 20 day SMA | 17.08 | 17.1 | 17.13 | | 35 day SMA | 17.18 | 17.16 | 17.14 | | 50 day SMA | 17.01 | 17 | 16.99 | | 100 day SMA | 16.19 | 16.16 | 16.14 | | 150 day SMA | 15.38 | 15.35 | 15.32 | | 200 day SMA | 14.7 | 14.68 | 14.66 |
|
|
