EL ELF full analysis,charts,indicators,moving averages,SMA,DMA,EMA,ADX,MACD,RSIE L ELF WideScreen charts, DMA,SMA,EMA technical analysis, forecast prediction, by indicators ADX,MACD,RSI,CCI USA stock exchange
operates under Consumer Non Durables sector & deals in Package Goods Cosmetics
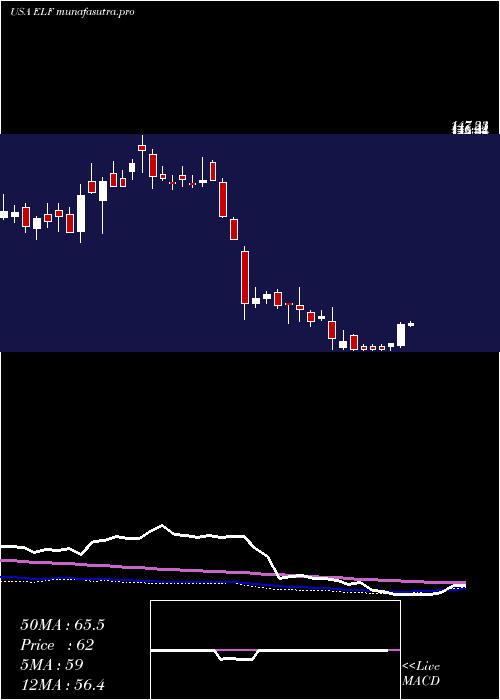
Daily price and charts and targets EL Strong Daily Stock price targets for EL ELF are 120.56 and 132.68 | Daily Target 1 | 118.3 | | Daily Target 2 | 122.82 | | Daily Target 3 | 130.41666666667 | | Daily Target 4 | 134.94 | | Daily Target 5 | 142.54 |
Daily price and volume E L
| Date |
Closing |
Open |
Range |
Volume |
Mon 20 October 2025 |
127.35 (-6.99%) |
138.01 |
125.89 - 138.01 |
1.4663 times |
Fri 17 October 2025 |
136.92 (0.79%) |
134.84 |
134.00 - 139.35 |
1.2121 times |
Thu 16 October 2025 |
135.85 (1.32%) |
135.40 |
133.70 - 141.50 |
1.1626 times |
Wed 15 October 2025 |
134.08 (1.2%) |
134.65 |
133.47 - 139.62 |
1.1116 times |
Tue 14 October 2025 |
132.49 (-0.15%) |
129.93 |
128.34 - 135.44 |
1.0569 times |
Mon 13 October 2025 |
132.69 (-5.63%) |
134.00 |
132.62 - 141.28 |
1.2191 times |
Tue 07 October 2025 |
140.60 (1.62%) |
139.11 |
138.25 - 141.89 |
0.8497 times |
Mon 06 October 2025 |
138.36 (2.64%) |
135.00 |
135.00 - 140.11 |
0.7768 times |
Fri 03 October 2025 |
134.80 (-0.82%) |
135.53 |
133.80 - 138.22 |
0.5794 times |
Thu 02 October 2025 |
135.91 (0.53%) |
134.28 |
132.47 - 136.75 |
0.5654 times |
Wed 01 October 2025 |
135.20 (2.05%) |
131.89 |
130.06 - 135.29 |
1.1114 times |
Weekly price and charts EL Strong weekly Stock price targets for EL ELF are 120.56 and 132.68 | Weekly Target 1 | 118.3 | | Weekly Target 2 | 122.82 | | Weekly Target 3 | 130.41666666667 | | Weekly Target 4 | 134.94 | | Weekly Target 5 | 142.54 |
Weekly price and volumes for E L
| Date |
Closing |
Open |
Range |
Volume |
Mon 20 October 2025 |
127.35 (-6.99%) |
138.01 |
125.89 - 138.01 |
0.2781 times |
Fri 17 October 2025 |
136.92 (-2.62%) |
134.00 |
128.34 - 141.50 |
1.093 times |
Tue 07 October 2025 |
140.60 (4.3%) |
135.00 |
135.00 - 141.89 |
0.3085 times |
Fri 03 October 2025 |
134.80 (3.88%) |
130.66 |
129.01 - 138.22 |
0.8531 times |
Fri 26 September 2025 |
129.77 (-7.28%) |
139.24 |
125.14 - 140.71 |
1.3183 times |
Fri 19 September 2025 |
139.96 (3.51%) |
136.39 |
135.30 - 150.99 |
1.6567 times |
Fri 12 September 2025 |
135.22 (0.93%) |
135.63 |
131.82 - 140.84 |
1.3899 times |
Fri 05 September 2025 |
133.97 (7.18%) |
120.46 |
119.02 - 138.77 |
1.3213 times |
Fri 29 August 2025 |
125.00 (0%) |
129.23 |
123.71 - 132.30 |
0.3029 times |
Fri 29 August 2025 |
125.00 (5.8%) |
115.59 |
112.42 - 132.30 |
1.4781 times |
Fri 22 August 2025 |
118.15 (1.53%) |
117.00 |
113.59 - 123.94 |
1.5505 times |
Monthly price and charts EL Strong monthly Stock price targets for EL ELF are 118.62 and 134.62 | Monthly Target 1 | 115.71 | | Monthly Target 2 | 121.53 | | Monthly Target 3 | 131.71 | | Monthly Target 4 | 137.53 | | Monthly Target 5 | 147.71 |
Monthly price and volumes E L
| Date |
Closing |
Open |
Range |
Volume |
Mon 20 October 2025 |
127.35 (-3.87%) |
131.89 |
125.89 - 141.89 |
0.262 times |
Tue 30 September 2025 |
132.48 (5.98%) |
120.46 |
119.02 - 150.99 |
0.7596 times |
Fri 29 August 2025 |
125.00 (3.14%) |
118.60 |
94.00 - 132.30 |
1.1093 times |
Thu 31 July 2025 |
121.19 (-2.61%) |
123.75 |
105.25 - 132.48 |
0.7847 times |
Mon 30 June 2025 |
124.44 (10.62%) |
112.97 |
109.88 - 130.67 |
0.8346 times |
Fri 30 May 2025 |
112.49 (81.82%) |
62.20 |
61.21 - 120.81 |
1.471 times |
Wed 30 April 2025 |
61.87 (-1.47%) |
64.41 |
49.40 - 68.99 |
1.1741 times |
Mon 31 March 2025 |
62.79 (-10.62%) |
70.75 |
60.35 - 78.00 |
0.9795 times |
Fri 28 February 2025 |
70.25 (-29.69%) |
94.74 |
63.50 - 96.98 |
1.8326 times |
Fri 31 January 2025 |
99.91 (-20.42%) |
126.66 |
99.91 - 137.19 |
0.7927 times |
Tue 31 December 2024 |
125.55 (1.01%) |
131.09 |
123.49 - 147.33 |
0.4132 times |

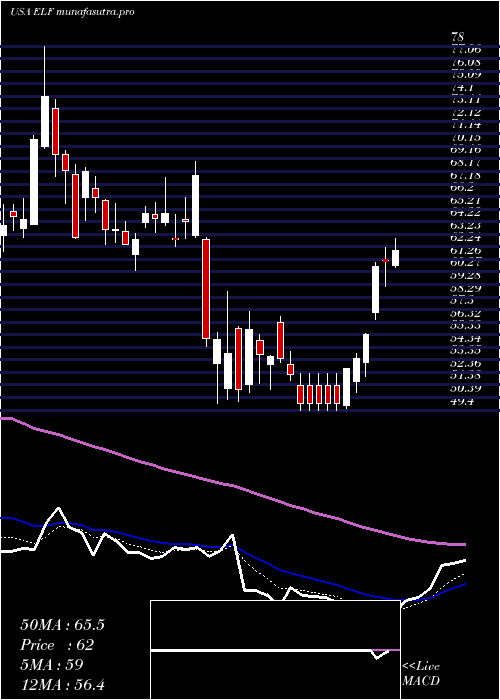
DMA SMA EMA moving averages of E L ELF
DMA (daily moving average) of E L ELF
| DMA period | DMA value | | 5 day DMA | 133.34 | | 12 day DMA | 134.73 | | 20 day DMA | 134.86 | | 35 day DMA | 134.81 | | 50 day DMA | 129.19 | | 100 day DMA | 122.66 | | 150 day DMA | 102.67 | | 200 day DMA | 100.85 | EMA (exponential moving average) of E L ELF
| EMA period | EMA current | EMA prev | EMA prev2 | | 5 day EMA | 132.85 | 135.6 | 134.94 | | 12 day EMA | 134.08 | 135.3 | 135 | | 20 day EMA | 134.07 | 134.78 | 134.55 | | 35 day EMA | 131.18 | 131.41 | 131.09 | | 50 day EMA | 128.53 | 128.58 | 128.24 |
SMA (simple moving average) of E L ELF
| SMA period | SMA current | SMA prev | SMA prev2 | | 5 day SMA | 133.34 | 134.41 | 135.14 | | 12 day SMA | 134.73 | 135.05 | 134.45 | | 20 day SMA | 134.86 | 135.8 | 136.12 | | 35 day SMA | 134.81 | 134.74 | 134.12 | | 50 day SMA | 129.19 | 128.86 | 128.31 | | 100 day SMA | 122.66 | 122.17 | 121.62 | | 150 day SMA | 102.67 | 102.28 | 101.83 | | 200 day SMA | 100.85 | 100.85 | 100.8 |
|
|
