EdisonInternational EIX full analysis,charts,indicators,moving averages,SMA,DMA,EMA,ADX,MACD,RSIEdison International EIX WideScreen charts, DMA,SMA,EMA technical analysis, forecast prediction, by indicators ADX,MACD,RSI,CCI USA stock exchange
operates under Public Utilities sector & deals in Electric Utilities Central
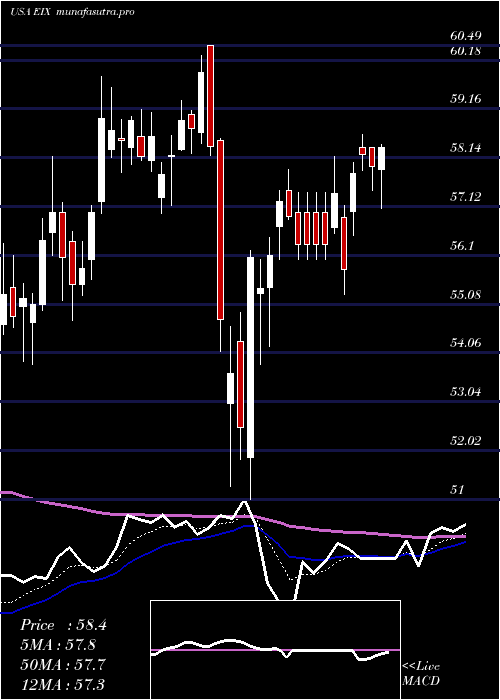
Daily price and charts and targets EdisonInternational Strong Daily Stock price targets for EdisonInternational EIX are 57.99 and 59.18 | Daily Target 1 | 57.07 | | Daily Target 2 | 57.72 | | Daily Target 3 | 58.263333333333 | | Daily Target 4 | 58.91 | | Daily Target 5 | 59.45 |
Daily price and volume Edison International
| Date |
Closing |
Open |
Range |
Volume |
Tue 21 October 2025 |
58.36 (1.23%) |
58.01 |
57.62 - 58.81 |
0.8124 times |
Mon 20 October 2025 |
57.65 (1.75%) |
57.18 |
56.72 - 57.76 |
1.0018 times |
Fri 17 October 2025 |
56.66 (-0.11%) |
56.69 |
56.23 - 57.08 |
0.7633 times |
Thu 16 October 2025 |
56.72 (-0.04%) |
57.32 |
56.50 - 58.07 |
0.8736 times |
Wed 15 October 2025 |
56.74 (1.19%) |
56.50 |
56.16 - 57.27 |
0.9644 times |
Tue 14 October 2025 |
56.07 (4.51%) |
53.69 |
53.59 - 56.22 |
1.359 times |
Mon 13 October 2025 |
53.65 (-0.07%) |
52.16 |
52.00 - 53.90 |
0.9985 times |
Tue 07 October 2025 |
53.69 (-2.03%) |
54.46 |
52.55 - 54.47 |
1.4582 times |
Mon 06 October 2025 |
54.80 (-0.99%) |
55.56 |
54.04 - 55.90 |
1.0247 times |
Fri 03 October 2025 |
55.35 (1.49%) |
54.50 |
54.39 - 55.75 |
0.7442 times |
Thu 02 October 2025 |
54.54 (-3.09%) |
56.28 |
53.49 - 56.30 |
1.6172 times |
Weekly price and charts EdisonInternational Strong weekly Stock price targets for EdisonInternational EIX are 57.54 and 59.63 | Weekly Target 1 | 55.87 | | Weekly Target 2 | 57.12 | | Weekly Target 3 | 57.963333333333 | | Weekly Target 4 | 59.21 | | Weekly Target 5 | 60.05 |
Weekly price and volumes for Edison International
| Date |
Closing |
Open |
Range |
Volume |
Tue 21 October 2025 |
58.36 (3%) |
57.18 |
56.72 - 58.81 |
0.3987 times |
Fri 17 October 2025 |
56.66 (5.53%) |
52.16 |
52.00 - 58.07 |
1.0898 times |
Tue 07 October 2025 |
53.69 (-3%) |
55.56 |
52.55 - 55.90 |
0.5457 times |
Fri 03 October 2025 |
55.35 (0.62%) |
55.18 |
53.49 - 56.51 |
1.2715 times |
Fri 26 September 2025 |
55.01 (-1.13%) |
55.47 |
53.75 - 56.10 |
1.1975 times |
Fri 19 September 2025 |
55.64 (-1%) |
56.70 |
54.85 - 57.00 |
1.3244 times |
Fri 12 September 2025 |
56.20 (3.21%) |
54.45 |
52.96 - 57.36 |
1.8686 times |
Fri 05 September 2025 |
54.45 (-2.99%) |
55.51 |
53.42 - 56.50 |
0.9767 times |
Fri 29 August 2025 |
56.13 (0%) |
54.81 |
54.81 - 57.62 |
0.2871 times |
Fri 29 August 2025 |
56.13 (0.95%) |
55.19 |
54.38 - 57.62 |
1.0401 times |
Fri 22 August 2025 |
55.60 (0.18%) |
55.72 |
53.39 - 57.26 |
0.9828 times |
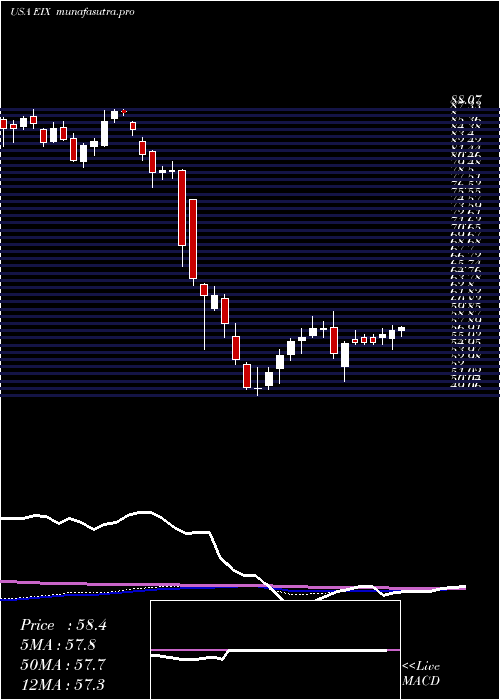
Monthly price and charts EdisonInternational Strong monthly Stock price targets for EdisonInternational EIX are 55.18 and 61.99 | Monthly Target 1 | 49.58 | | Monthly Target 2 | 53.97 | | Monthly Target 3 | 56.39 | | Monthly Target 4 | 60.78 | | Monthly Target 5 | 63.2 |
Monthly price and volumes Edison International
| Date |
Closing |
Open |
Range |
Volume |
Tue 21 October 2025 |
58.36 (5.57%) |
55.47 |
52.00 - 58.81 |
0.4225 times |
Tue 30 September 2025 |
55.28 (-1.51%) |
55.51 |
52.96 - 57.36 |
0.8786 times |
Fri 29 August 2025 |
56.13 (7.69%) |
52.20 |
51.40 - 57.62 |
0.797 times |
Thu 31 July 2025 |
52.12 (1.01%) |
51.83 |
49.14 - 53.35 |
1.0344 times |
Mon 30 June 2025 |
51.60 (-7.28%) |
55.42 |
47.73 - 56.33 |
1.0711 times |
Fri 30 May 2025 |
55.65 (4%) |
53.75 |
53.66 - 58.63 |
0.6605 times |
Wed 30 April 2025 |
53.51 (-9.18%) |
59.04 |
51.00 - 60.49 |
0.795 times |
Mon 31 March 2025 |
58.92 (8.23%) |
54.65 |
53.81 - 59.84 |
1.0326 times |
Fri 28 February 2025 |
54.44 (0.81%) |
53.24 |
49.06 - 55.39 |
1.2939 times |
Fri 31 January 2025 |
54.00 (-32.36%) |
80.76 |
53.26 - 81.02 |
2.0144 times |
Tue 31 December 2024 |
79.84 (-9%) |
86.25 |
77.42 - 86.48 |
0.381 times |

DMA SMA EMA moving averages of Edison International EIX
DMA (daily moving average) of Edison International EIX
| DMA period | DMA value | | 5 day DMA | 57.23 | | 12 day DMA | 55.88 | | 20 day DMA | 55.52 | | 35 day DMA | 55.46 | | 50 day DMA | 55.42 | | 100 day DMA | 53.81 | | 150 day DMA | 54.83 | | 200 day DMA | 55.66 | EMA (exponential moving average) of Edison International EIX
| EMA period | EMA current | EMA prev | EMA prev2 | | 5 day EMA | 57.23 | 56.66 | 56.16 | | 12 day EMA | 56.31 | 55.94 | 55.63 | | 20 day EMA | 55.92 | 55.66 | 55.45 | | 35 day EMA | 55.59 | 55.43 | 55.3 | | 50 day EMA | 55.49 | 55.37 | 55.28 |
SMA (simple moving average) of Edison International EIX
| SMA period | SMA current | SMA prev | SMA prev2 | | 5 day SMA | 57.23 | 56.77 | 55.97 | | 12 day SMA | 55.88 | 55.62 | 55.42 | | 20 day SMA | 55.52 | 55.38 | 55.27 | | 35 day SMA | 55.46 | 55.36 | 55.29 | | 50 day SMA | 55.42 | 55.35 | 55.29 | | 100 day SMA | 53.81 | 53.78 | 53.78 | | 150 day SMA | 54.83 | 54.81 | 54.8 | | 200 day SMA | 55.66 | 55.76 | 55.87 |
|
|
