EmployersHoldings EIG full analysis,charts,indicators,moving averages,SMA,DMA,EMA,ADX,MACD,RSIEmployers Holdings EIG WideScreen charts, DMA,SMA,EMA technical analysis, forecast prediction, by indicators ADX,MACD,RSI,CCI USA stock exchange
operates under Finance sector & deals in Property Casualty Insurers
Daily price and charts and targets EmployersHoldings Strong Daily Stock price targets for EmployersHoldings EIG are 38.88 and 39.47 | Daily Target 1 | 38.75 | | Daily Target 2 | 39.01 | | Daily Target 3 | 39.343333333333 | | Daily Target 4 | 39.6 | | Daily Target 5 | 39.93 |
Daily price and volume Employers Holdings
| Date |
Closing |
Open |
Range |
Volume |
Fri 05 December 2025 |
39.26 (-0.83%) |
39.46 |
39.09 - 39.68 |
0.9065 times |
Thu 04 December 2025 |
39.59 (-0.43%) |
39.70 |
39.53 - 40.03 |
0.7962 times |
Wed 03 December 2025 |
39.76 (-0.3%) |
39.91 |
39.48 - 40.22 |
0.9366 times |
Tue 02 December 2025 |
39.88 (-0.55%) |
40.23 |
39.80 - 40.23 |
0.9267 times |
Mon 01 December 2025 |
40.10 (0.63%) |
39.77 |
39.77 - 40.38 |
1.3714 times |
Fri 28 November 2025 |
39.85 (0.63%) |
39.55 |
39.55 - 40.13 |
0.7042 times |
Wed 26 November 2025 |
39.60 (0.03%) |
39.68 |
39.60 - 40.04 |
1.1767 times |
Tue 25 November 2025 |
39.59 (1.46%) |
39.38 |
39.22 - 39.88 |
1.0152 times |
Mon 24 November 2025 |
39.02 (-1.06%) |
39.31 |
38.98 - 39.55 |
0.9946 times |
Fri 21 November 2025 |
39.44 (1.78%) |
39.02 |
38.90 - 39.88 |
1.1719 times |
Thu 20 November 2025 |
38.75 (0.36%) |
38.63 |
38.45 - 39.06 |
1.1045 times |
Weekly price and charts EmployersHoldings Strong weekly Stock price targets for EmployersHoldings EIG are 38.53 and 39.82 | Weekly Target 1 | 38.29 | | Weekly Target 2 | 38.77 | | Weekly Target 3 | 39.576666666667 | | Weekly Target 4 | 40.06 | | Weekly Target 5 | 40.87 |
Weekly price and volumes for Employers Holdings
| Date |
Closing |
Open |
Range |
Volume |
Fri 05 December 2025 |
39.26 (-1.48%) |
39.77 |
39.09 - 40.38 |
1.4078 times |
Fri 28 November 2025 |
39.85 (1.04%) |
39.31 |
38.98 - 40.13 |
1.1093 times |
Fri 21 November 2025 |
39.44 (0.48%) |
39.29 |
38.42 - 39.88 |
1.3673 times |
Fri 14 November 2025 |
39.25 (2.21%) |
38.15 |
37.67 - 39.59 |
1.2302 times |
Fri 07 November 2025 |
38.40 (0.71%) |
36.17 |
36.00 - 38.69 |
1.2606 times |
Fri 31 October 2025 |
38.13 (0%) |
39.24 |
36.72 - 39.56 |
0.4892 times |
Fri 31 October 2025 |
38.13 (-8.25%) |
41.64 |
36.72 - 41.77 |
1.1527 times |
Fri 24 October 2025 |
41.56 (0.75%) |
41.37 |
41.24 - 42.32 |
0.6504 times |
Fri 17 October 2025 |
41.25 (-0.41%) |
41.37 |
40.20 - 42.42 |
0.6904 times |
Fri 10 October 2025 |
41.42 (-2.75%) |
42.42 |
41.38 - 42.87 |
0.6419 times |
Fri 03 October 2025 |
42.59 (0.66%) |
42.28 |
41.66 - 42.94 |
0.6635 times |

Monthly price and charts EmployersHoldings Strong monthly Stock price targets for EmployersHoldings EIG are 38.53 and 39.82 | Monthly Target 1 | 38.29 | | Monthly Target 2 | 38.77 | | Monthly Target 3 | 39.576666666667 | | Monthly Target 4 | 40.06 | | Monthly Target 5 | 40.87 |
Monthly price and volumes Employers Holdings
| Date |
Closing |
Open |
Range |
Volume |
Fri 05 December 2025 |
39.26 (-1.48%) |
39.77 |
39.09 - 40.38 |
0.3522 times |
Fri 28 November 2025 |
39.85 (4.51%) |
36.17 |
36.00 - 40.13 |
1.2428 times |
Fri 31 October 2025 |
38.13 (-10.24%) |
42.18 |
36.72 - 42.94 |
1.0014 times |
Tue 30 September 2025 |
42.48 (-1.8%) |
43.05 |
40.96 - 43.53 |
1.2485 times |
Fri 29 August 2025 |
43.26 (4.8%) |
40.89 |
38.19 - 44.00 |
1.233 times |
Thu 31 July 2025 |
41.28 (-12.51%) |
47.08 |
41.15 - 47.91 |
1.0644 times |
Mon 30 June 2025 |
47.18 (-3.06%) |
48.40 |
45.97 - 48.83 |
0.9607 times |
Fri 30 May 2025 |
48.67 (0.16%) |
48.19 |
47.56 - 50.37 |
0.9552 times |
Wed 30 April 2025 |
48.59 (-4.05%) |
50.56 |
45.18 - 51.48 |
0.9091 times |
Mon 31 March 2025 |
50.64 (-2.24%) |
51.60 |
47.78 - 52.29 |
1.0327 times |
Fri 28 February 2025 |
51.80 (5.37%) |
48.59 |
48.06 - 51.82 |
0.7611 times |

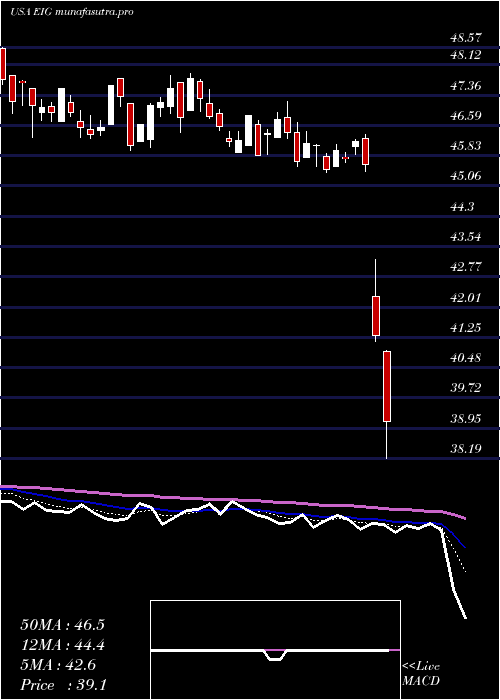
DMA SMA EMA moving averages of Employers Holdings EIG
DMA (daily moving average) of Employers Holdings EIG
| DMA period | DMA value | | 5 day DMA | 39.72 | | 12 day DMA | 39.45 | | 20 day DMA | 39.29 | | 35 day DMA | 39.69 | | 50 day DMA | 40.39 | | 100 day DMA | 41.67 | | 150 day DMA | 43.71 | | 200 day DMA | 45.1 | EMA (exponential moving average) of Employers Holdings EIG
| EMA period | EMA current | EMA prev | EMA prev2 | | 5 day EMA | 39.56 | 39.71 | 39.77 | | 12 day EMA | 39.51 | 39.56 | 39.56 | | 20 day EMA | 39.53 | 39.56 | 39.56 | | 35 day EMA | 39.98 | 40.02 | 40.05 | | 50 day EMA | 40.46 | 40.51 | 40.55 |
SMA (simple moving average) of Employers Holdings EIG
| SMA period | SMA current | SMA prev | SMA prev2 | | 5 day SMA | 39.72 | 39.84 | 39.84 | | 12 day SMA | 39.45 | 39.48 | 39.43 | | 20 day SMA | 39.29 | 39.24 | 39.14 | | 35 day SMA | 39.69 | 39.73 | 39.79 | | 50 day SMA | 40.39 | 40.44 | 40.49 | | 100 day SMA | 41.67 | 41.74 | 41.8 | | 150 day SMA | 43.71 | 43.77 | 43.83 | | 200 day SMA | 45.1 | 45.15 | 45.2 |
|
|
