EhealthInc EHTH full analysis,charts,indicators,moving averages,SMA,DMA,EMA,ADX,MACD,RSIEhealth Inc EHTH WideScreen charts, DMA,SMA,EMA technical analysis, forecast prediction, by indicators ADX,MACD,RSI,CCI USA stock exchange
operates under Finance sector & deals in Specialty Insurers
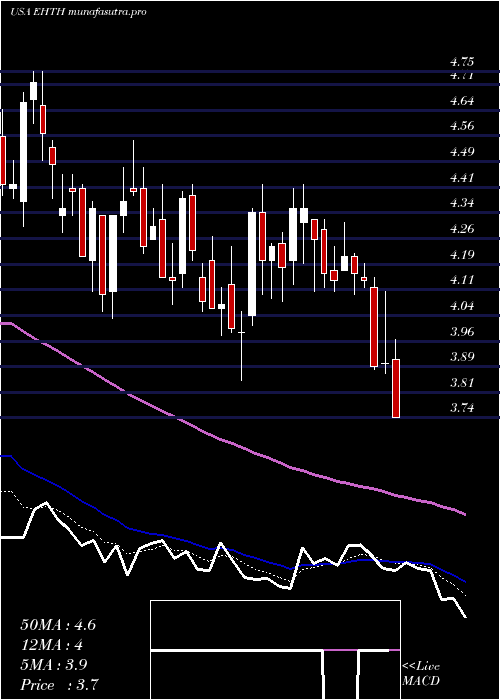
Daily price and charts and targets EhealthInc Strong Daily Stock price targets for EhealthInc EHTH are 5 and 5.59 | Daily Target 1 | 4.54 | | Daily Target 2 | 4.87 | | Daily Target 3 | 5.1266666666667 | | Daily Target 4 | 5.46 | | Daily Target 5 | 5.72 |
Daily price and volume Ehealth Inc
| Date |
Closing |
Open |
Range |
Volume |
Mon 20 October 2025 |
5.21 (9.22%) |
4.87 |
4.79 - 5.38 |
1.7678 times |
Fri 17 October 2025 |
4.77 (3.47%) |
4.52 |
4.45 - 4.84 |
1.1737 times |
Thu 16 October 2025 |
4.61 (-7.43%) |
4.97 |
4.53 - 5.03 |
0.8502 times |
Wed 15 October 2025 |
4.98 (5.96%) |
5.02 |
4.82 - 5.35 |
1.1724 times |
Tue 14 October 2025 |
4.70 (8.29%) |
4.27 |
4.21 - 4.78 |
0.7558 times |
Mon 13 October 2025 |
4.34 (-2.03%) |
4.46 |
4.25 - 4.50 |
0.5862 times |
Fri 10 October 2025 |
4.43 (-4.73%) |
4.64 |
4.42 - 4.70 |
0.8376 times |
Thu 09 October 2025 |
4.65 (-3.33%) |
4.85 |
4.63 - 4.94 |
0.6124 times |
Wed 08 October 2025 |
4.81 (-3.02%) |
5.01 |
4.73 - 5.31 |
0.8669 times |
Tue 07 October 2025 |
4.96 (-6.06%) |
5.33 |
4.91 - 5.33 |
1.3768 times |
Mon 06 October 2025 |
5.28 (17.33%) |
4.50 |
4.44 - 5.34 |
2.4248 times |
Weekly price and charts EhealthInc Strong weekly Stock price targets for EhealthInc EHTH are 5 and 5.59 | Weekly Target 1 | 4.54 | | Weekly Target 2 | 4.87 | | Weekly Target 3 | 5.1266666666667 | | Weekly Target 4 | 5.46 | | Weekly Target 5 | 5.72 |
Weekly price and volumes for Ehealth Inc
| Date |
Closing |
Open |
Range |
Volume |
Mon 20 October 2025 |
5.21 (9.22%) |
4.87 |
4.79 - 5.38 |
0.5295 times |
Fri 17 October 2025 |
4.77 (7.67%) |
4.46 |
4.21 - 5.35 |
1.3593 times |
Fri 10 October 2025 |
4.43 (-1.56%) |
4.50 |
4.42 - 5.34 |
1.8325 times |
Fri 03 October 2025 |
4.50 (14.21%) |
3.98 |
3.83 - 4.55 |
1.4351 times |
Fri 26 September 2025 |
3.94 (-0.76%) |
3.96 |
3.85 - 4.24 |
0.7194 times |
Fri 19 September 2025 |
3.97 (-0.5%) |
4.02 |
3.82 - 4.07 |
0.9968 times |
Fri 12 September 2025 |
3.99 (-2.44%) |
4.10 |
3.75 - 4.11 |
0.9925 times |
Fri 05 September 2025 |
4.09 (5.68%) |
3.82 |
3.81 - 4.17 |
1.0349 times |
Fri 29 August 2025 |
3.87 (0%) |
3.91 |
3.81 - 3.99 |
0.1821 times |
Fri 29 August 2025 |
3.87 (0.78%) |
3.83 |
3.70 - 3.99 |
0.9179 times |
Fri 22 August 2025 |
3.84 (11.95%) |
3.42 |
3.40 - 3.97 |
1.114 times |
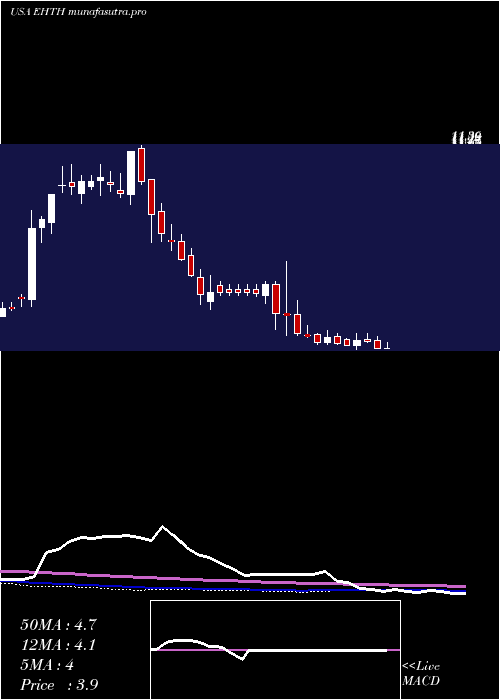
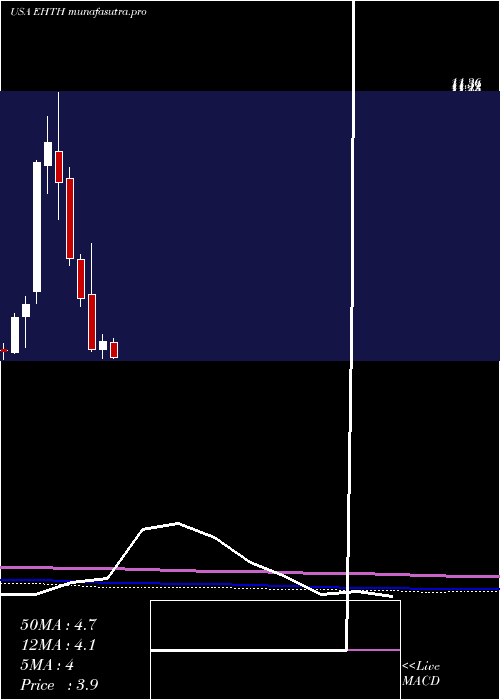
Monthly price and charts EhealthInc Strong monthly Stock price targets for EhealthInc EHTH are 4.62 and 5.97 | Monthly Target 1 | 3.52 | | Monthly Target 2 | 4.37 | | Monthly Target 3 | 4.8733333333333 | | Monthly Target 4 | 5.72 | | Monthly Target 5 | 6.22 |
Monthly price and volumes Ehealth Inc
| Date |
Closing |
Open |
Range |
Volume |
Mon 20 October 2025 |
5.21 (20.88%) |
4.31 |
4.03 - 5.38 |
0.7872 times |
Tue 30 September 2025 |
4.31 (11.37%) |
3.82 |
3.75 - 4.39 |
0.8024 times |
Fri 29 August 2025 |
3.87 (13.82%) |
3.38 |
3.20 - 4.91 |
1.8887 times |
Thu 31 July 2025 |
3.40 (-21.84%) |
4.31 |
3.32 - 4.42 |
1.0909 times |
Mon 30 June 2025 |
4.35 (6.1%) |
4.11 |
3.85 - 4.55 |
1.1867 times |
Fri 30 May 2025 |
4.10 (-26.26%) |
5.66 |
4.05 - 7.09 |
1.3191 times |
Wed 30 April 2025 |
5.56 (-16.77%) |
6.64 |
5.33 - 6.79 |
0.4588 times |
Mon 31 March 2025 |
6.68 (-24.18%) |
8.94 |
6.48 - 9.24 |
0.6248 times |
Fri 28 February 2025 |
8.81 (-11.37%) |
9.71 |
7.79 - 11.36 |
0.8825 times |
Fri 31 January 2025 |
9.94 (5.74%) |
9.30 |
8.51 - 10.68 |
0.9589 times |
Tue 31 December 2024 |
9.40 (75.05%) |
5.75 |
5.42 - 9.45 |
0.983 times |
DMA SMA EMA moving averages of Ehealth Inc EHTH
DMA (daily moving average) of Ehealth Inc EHTH
| DMA period | DMA value | | 5 day DMA | 4.85 | | 12 day DMA | 4.77 | | 20 day DMA | 4.5 | | 35 day DMA | 4.27 | | 50 day DMA | 4.09 | | 100 day DMA | 4.05 | | 150 day DMA | 4.63 | | 200 day DMA | 5.86 | EMA (exponential moving average) of Ehealth Inc EHTH
| EMA period | EMA current | EMA prev | EMA prev2 | | 5 day EMA | 4.88 | 4.71 | 4.68 | | 12 day EMA | 4.7 | 4.61 | 4.58 | | 20 day EMA | 4.56 | 4.49 | 4.46 | | 35 day EMA | 4.35 | 4.3 | 4.27 | | 50 day EMA | 4.14 | 4.1 | 4.07 |
SMA (simple moving average) of Ehealth Inc EHTH
| SMA period | SMA current | SMA prev | SMA prev2 | | 5 day SMA | 4.85 | 4.68 | 4.61 | | 12 day SMA | 4.77 | 4.69 | 4.64 | | 20 day SMA | 4.5 | 4.44 | 4.4 | | 35 day SMA | 4.27 | 4.23 | 4.21 | | 50 day SMA | 4.09 | 4.05 | 4.03 | | 100 day SMA | 4.05 | 4.04 | 4.04 | | 150 day SMA | 4.63 | 4.65 | 4.67 | | 200 day SMA | 5.86 | 5.88 | 5.9 |
|
|
