EastgroupProperties EGP full analysis,charts,indicators,moving averages,SMA,DMA,EMA,ADX,MACD,RSIEastgroup Properties EGP WideScreen charts, DMA,SMA,EMA technical analysis, forecast prediction, by indicators ADX,MACD,RSI,CCI USA stock exchange
operates under Consumer Services sector & deals in Real Estate Investment Trusts
Daily price and charts and targets EastgroupProperties Strong Daily Stock price targets for EastgroupProperties EGP are 179.21 and 182.06 | Daily Target 1 | 176.88 | | Daily Target 2 | 178.68 | | Daily Target 3 | 179.73 | | Daily Target 4 | 181.53 | | Daily Target 5 | 182.58 |
Daily price and volume Eastgroup Properties
| Date |
Closing |
Open |
Range |
Volume |
Thu 04 December 2025 |
180.48 (0.69%) |
179.14 |
177.93 - 180.78 |
0.9505 times |
Wed 03 December 2025 |
179.24 (-0.12%) |
178.80 |
177.35 - 179.72 |
1.2538 times |
Tue 02 December 2025 |
179.45 (-0.6%) |
180.54 |
179.19 - 181.50 |
0.7691 times |
Mon 01 December 2025 |
180.54 (-0.35%) |
180.23 |
177.17 - 181.66 |
0.6502 times |
Fri 28 November 2025 |
181.18 (0%) |
182.16 |
180.29 - 182.34 |
0.4153 times |
Wed 26 November 2025 |
181.18 (0.12%) |
180.34 |
180.34 - 182.70 |
0.7162 times |
Tue 25 November 2025 |
180.97 (0.59%) |
179.65 |
179.32 - 182.31 |
1.2703 times |
Mon 24 November 2025 |
179.90 (0.06%) |
179.79 |
177.37 - 180.71 |
1.3489 times |
Fri 21 November 2025 |
179.79 (2.32%) |
176.83 |
174.88 - 179.84 |
1.3885 times |
Thu 20 November 2025 |
175.72 (-0.93%) |
179.03 |
175.41 - 180.22 |
1.2372 times |
Wed 19 November 2025 |
177.37 (-1.52%) |
180.26 |
175.41 - 181.16 |
1.7893 times |
Weekly price and charts EastgroupProperties Strong weekly Stock price targets for EastgroupProperties EGP are 178.83 and 183.32 | Weekly Target 1 | 175.28 | | Weekly Target 2 | 177.88 | | Weekly Target 3 | 179.77 | | Weekly Target 4 | 182.37 | | Weekly Target 5 | 184.26 |
Weekly price and volumes for Eastgroup Properties
| Date |
Closing |
Open |
Range |
Volume |
Thu 04 December 2025 |
180.48 (-0.39%) |
180.23 |
177.17 - 181.66 |
0.7753 times |
Fri 28 November 2025 |
181.18 (0.77%) |
179.79 |
177.37 - 182.70 |
0.8025 times |
Fri 21 November 2025 |
179.79 (1.77%) |
177.12 |
174.88 - 181.16 |
1.4144 times |
Fri 14 November 2025 |
176.66 (-0.59%) |
177.79 |
175.71 - 179.60 |
1.0641 times |
Fri 07 November 2025 |
177.70 (1.82%) |
175.76 |
174.21 - 177.80 |
0.7294 times |
Fri 31 October 2025 |
174.53 (0%) |
175.18 |
174.12 - 176.11 |
0.2574 times |
Fri 31 October 2025 |
174.53 (-1.51%) |
178.26 |
172.87 - 180.60 |
1.2294 times |
Fri 24 October 2025 |
177.20 (-1.48%) |
181.05 |
173.00 - 183.38 |
1.5015 times |
Fri 17 October 2025 |
179.86 (8.27%) |
166.49 |
166.49 - 180.25 |
1.4317 times |
Fri 10 October 2025 |
166.12 (-2.94%) |
172.49 |
166.11 - 173.21 |
0.7945 times |
Fri 03 October 2025 |
171.15 (1.7%) |
168.47 |
167.25 - 172.92 |
1.0626 times |

Monthly price and charts EastgroupProperties Strong monthly Stock price targets for EastgroupProperties EGP are 178.83 and 183.32 | Monthly Target 1 | 175.28 | | Monthly Target 2 | 177.88 | | Monthly Target 3 | 179.77 | | Monthly Target 4 | 182.37 | | Monthly Target 5 | 184.26 |
Monthly price and volumes Eastgroup Properties
| Date |
Closing |
Open |
Range |
Volume |
Thu 04 December 2025 |
180.48 (-0.39%) |
180.23 |
177.17 - 181.66 |
0.145 times |
Fri 28 November 2025 |
181.18 (3.81%) |
175.76 |
174.21 - 182.70 |
0.7501 times |
Fri 31 October 2025 |
174.53 (3.11%) |
169.55 |
166.11 - 183.38 |
1.0729 times |
Tue 30 September 2025 |
169.26 (-0.18%) |
167.63 |
163.10 - 171.84 |
1.1519 times |
Fri 29 August 2025 |
169.56 (3.87%) |
164.36 |
159.37 - 171.25 |
0.9359 times |
Thu 31 July 2025 |
163.24 (-2.32%) |
165.83 |
160.78 - 171.15 |
1.3676 times |
Mon 30 June 2025 |
167.12 (-1.43%) |
168.60 |
163.65 - 175.09 |
0.8279 times |
Fri 30 May 2025 |
169.55 (3.75%) |
164.38 |
162.53 - 174.47 |
0.8623 times |
Wed 30 April 2025 |
163.42 (-7.23%) |
177.02 |
137.67 - 177.97 |
1.5849 times |
Mon 31 March 2025 |
176.15 (-3.66%) |
183.84 |
172.15 - 188.89 |
1.3013 times |
Fri 28 February 2025 |
182.85 (7.8%) |
166.39 |
165.86 - 183.36 |
1.2091 times |

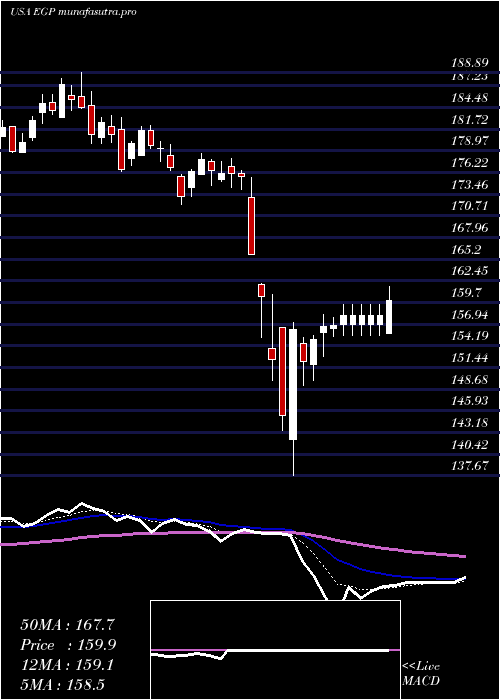
DMA SMA EMA moving averages of Eastgroup Properties EGP
DMA (daily moving average) of Eastgroup Properties EGP
| DMA period | DMA value | | 5 day DMA | 180.18 | | 12 day DMA | 179.66 | | 20 day DMA | 178.69 | | 35 day DMA | 178.14 | | 50 day DMA | 175.75 | | 100 day DMA | 170.63 | | 150 day DMA | 170.12 | | 200 day DMA | 170.2 | EMA (exponential moving average) of Eastgroup Properties EGP
| EMA period | EMA current | EMA prev | EMA prev2 | | 5 day EMA | 180.05 | 179.83 | 180.12 | | 12 day EMA | 179.54 | 179.37 | 179.39 | | 20 day EMA | 178.78 | 178.6 | 178.53 | | 35 day EMA | 177.11 | 176.91 | 176.77 | | 50 day EMA | 175.48 | 175.28 | 175.12 |
SMA (simple moving average) of Eastgroup Properties EGP
| SMA period | SMA current | SMA prev | SMA prev2 | | 5 day SMA | 180.18 | 180.32 | 180.66 | | 12 day SMA | 179.66 | 179.42 | 179.2 | | 20 day SMA | 178.69 | 178.41 | 178.2 | | 35 day SMA | 178.14 | 177.97 | 177.71 | | 50 day SMA | 175.75 | 175.44 | 175.21 | | 100 day SMA | 170.63 | 170.46 | 170.35 | | 150 day SMA | 170.12 | 170.01 | 169.9 | | 200 day SMA | 170.2 | 170.2 | 170.2 |
|
|
