EldoradoGold EGO full analysis,charts,indicators,moving averages,SMA,DMA,EMA,ADX,MACD,RSIEldorado Gold EGO WideScreen charts, DMA,SMA,EMA technical analysis, forecast prediction, by indicators ADX,MACD,RSI,CCI USA stock exchange
operates under Basic Industries sector & deals in Precious Metals
Daily price and charts and targets EldoradoGold Strong Daily Stock price targets for EldoradoGold EGO are 28.47 and 29.36 | Daily Target 1 | 27.79 | | Daily Target 2 | 28.26 | | Daily Target 3 | 28.676666666667 | | Daily Target 4 | 29.15 | | Daily Target 5 | 29.57 |
Daily price and volume Eldorado Gold
| Date |
Closing |
Open |
Range |
Volume |
Mon 20 October 2025 |
28.74 (0.95%) |
28.48 |
28.20 - 29.09 |
0.7136 times |
Fri 17 October 2025 |
28.47 (-9.24%) |
30.85 |
28.02 - 31.50 |
0.7838 times |
Thu 16 October 2025 |
31.37 (7.51%) |
29.49 |
29.29 - 31.95 |
1.481 times |
Wed 15 October 2025 |
29.18 (3%) |
28.64 |
28.49 - 29.38 |
0.9717 times |
Tue 14 October 2025 |
28.33 (-1.5%) |
28.30 |
28.15 - 29.02 |
0.9576 times |
Mon 13 October 2025 |
28.76 (4.2%) |
28.44 |
28.40 - 29.26 |
0.693 times |
Fri 10 October 2025 |
27.60 (0.95%) |
27.60 |
27.34 - 28.02 |
1.2894 times |
Thu 09 October 2025 |
27.34 (-5.85%) |
29.10 |
27.02 - 29.14 |
1.2941 times |
Wed 08 October 2025 |
29.04 (-0.17%) |
29.99 |
28.83 - 30.00 |
1.1044 times |
Tue 07 October 2025 |
29.09 (-2.38%) |
29.79 |
28.87 - 29.92 |
0.7115 times |
Mon 06 October 2025 |
29.80 (2.58%) |
29.67 |
29.40 - 29.99 |
1.3743 times |
Weekly price and charts EldoradoGold Strong weekly Stock price targets for EldoradoGold EGO are 28.47 and 29.36 | Weekly Target 1 | 27.79 | | Weekly Target 2 | 28.26 | | Weekly Target 3 | 28.676666666667 | | Weekly Target 4 | 29.15 | | Weekly Target 5 | 29.57 |
Weekly price and volumes for Eldorado Gold
| Date |
Closing |
Open |
Range |
Volume |
Mon 20 October 2025 |
28.74 (0.95%) |
28.48 |
28.20 - 29.09 |
0.2001 times |
Fri 17 October 2025 |
28.47 (3.15%) |
28.44 |
28.02 - 31.95 |
1.3701 times |
Fri 10 October 2025 |
27.60 (-4.99%) |
29.67 |
27.02 - 30.00 |
1.6187 times |
Fri 03 October 2025 |
29.05 (0.69%) |
29.50 |
27.96 - 29.91 |
1.1259 times |
Fri 26 September 2025 |
28.85 (3.37%) |
28.34 |
27.89 - 29.24 |
1.4551 times |
Fri 19 September 2025 |
27.91 (-0.53%) |
28.25 |
26.48 - 28.66 |
1.563 times |
Fri 12 September 2025 |
28.06 (7.43%) |
26.50 |
26.03 - 28.23 |
0.9556 times |
Fri 05 September 2025 |
26.12 (5.41%) |
25.18 |
24.36 - 26.17 |
0.9224 times |
Fri 29 August 2025 |
24.78 (0%) |
24.00 |
23.95 - 25.00 |
0.1465 times |
Fri 29 August 2025 |
24.78 (5.49%) |
23.57 |
23.33 - 25.00 |
0.6427 times |
Fri 22 August 2025 |
23.49 (2.89%) |
22.95 |
21.84 - 23.74 |
0.6413 times |
Monthly price and charts EldoradoGold Strong monthly Stock price targets for EldoradoGold EGO are 25.42 and 30.35 | Monthly Target 1 | 24.31 | | Monthly Target 2 | 26.52 | | Monthly Target 3 | 29.236666666667 | | Monthly Target 4 | 31.45 | | Monthly Target 5 | 34.17 |
Monthly price and volumes Eldorado Gold
| Date |
Closing |
Open |
Range |
Volume |
Mon 20 October 2025 |
28.74 (-0.52%) |
29.07 |
27.02 - 31.95 |
0.8767 times |
Tue 30 September 2025 |
28.89 (16.59%) |
25.18 |
24.36 - 29.58 |
1.2809 times |
Fri 29 August 2025 |
24.78 (20.88%) |
20.71 |
20.67 - 25.00 |
0.8353 times |
Thu 31 July 2025 |
20.50 (0.79%) |
20.79 |
19.62 - 21.24 |
0.8707 times |
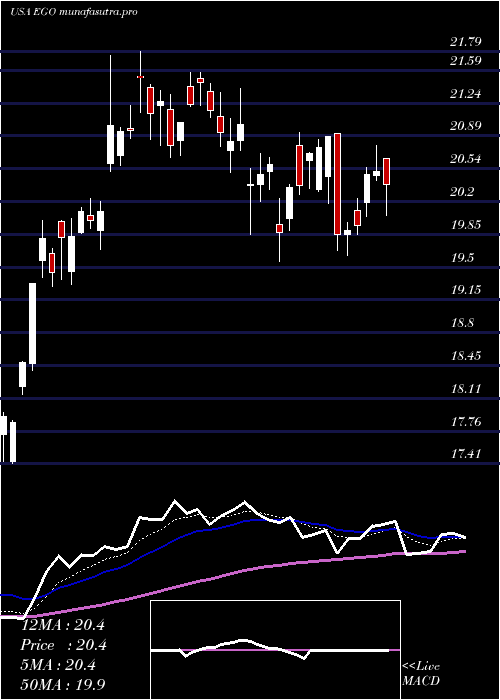
Mon 30 June 2025 |
20.34 (1.24%) |
20.60 |
19.56 - 21.79 |
0.9735 times |
Fri 30 May 2025 |
20.09 (6.63%) |
18.30 |
17.18 - 20.44 |
1.1002 times |
Wed 30 April 2025 |
18.84 (12.01%) |
16.72 |
15.30 - 20.65 |
1.3483 times |
Mon 31 March 2025 |
16.82 (22.15%) |
14.05 |
13.38 - 17.18 |
0.7904 times |
Fri 28 February 2025 |
13.77 (-9.65%) |
15.23 |
13.29 - 16.27 |
1.1293 times |
Fri 31 January 2025 |
15.24 (2.49%) |
15.30 |
14.26 - 16.49 |
0.7947 times |
Tue 31 December 2024 |
14.87 (-5.29%) |
16.00 |
14.55 - 17.37 |
0.3714 times |
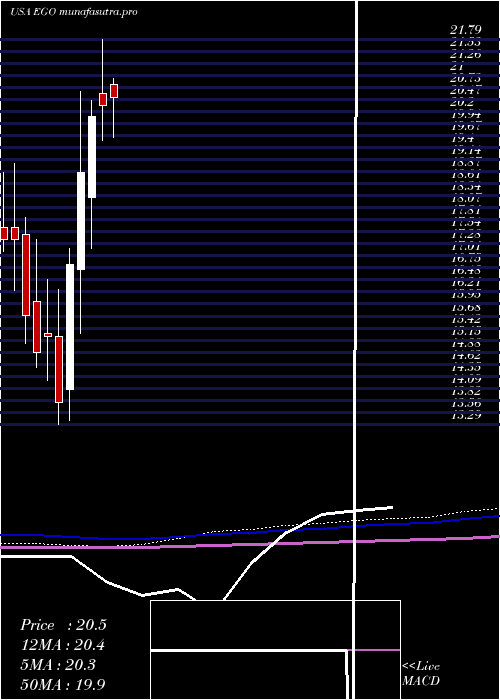
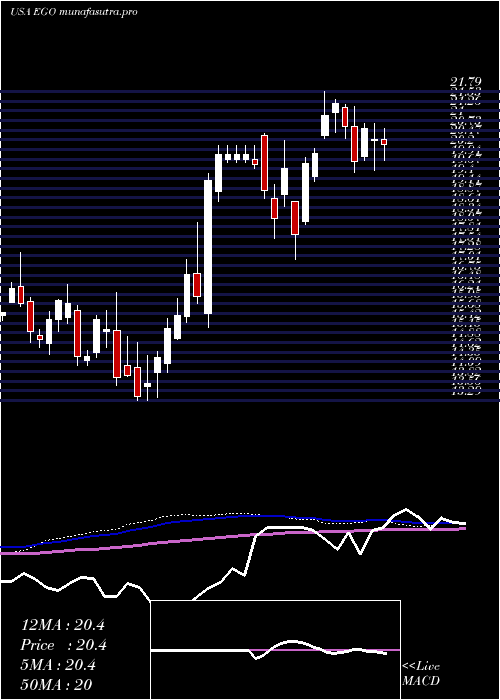
DMA SMA EMA moving averages of Eldorado Gold EGO
DMA (daily moving average) of Eldorado Gold EGO
| DMA period | DMA value | | 5 day DMA | 29.22 | | 12 day DMA | 28.9 | | 20 day DMA | 28.84 | | 35 day DMA | 28 | | 50 day DMA | 26.6 | | 100 day DMA | 23.72 | | 150 day DMA | 21.94 | | 200 day DMA | 20.14 | EMA (exponential moving average) of Eldorado Gold EGO
| EMA period | EMA current | EMA prev | EMA prev2 | | 5 day EMA | 29.05 | 29.2 | 29.56 | | 12 day EMA | 28.9 | 28.93 | 29.01 | | 20 day EMA | 28.58 | 28.56 | 28.57 | | 35 day EMA | 27.59 | 27.52 | 27.46 | | 50 day EMA | 26.55 | 26.46 | 26.38 |
SMA (simple moving average) of Eldorado Gold EGO
| SMA period | SMA current | SMA prev | SMA prev2 | | 5 day SMA | 29.22 | 29.22 | 29.05 | | 12 day SMA | 28.9 | 28.94 | 29.02 | | 20 day SMA | 28.84 | 28.83 | 28.8 | | 35 day SMA | 28 | 27.89 | 27.78 | | 50 day SMA | 26.6 | 26.47 | 26.36 | | 100 day SMA | 23.72 | 23.63 | 23.55 | | 150 day SMA | 21.94 | 21.85 | 21.76 | | 200 day SMA | 20.14 | 20.08 | 20.01 |
|
|
