EagleBancorp EGBN full analysis,charts,indicators,moving averages,SMA,DMA,EMA,ADX,MACD,RSIEagle Bancorp EGBN WideScreen charts, DMA,SMA,EMA technical analysis, forecast prediction, by indicators ADX,MACD,RSI,CCI USA stock exchange
operates under Finance sector & deals in Major Banks
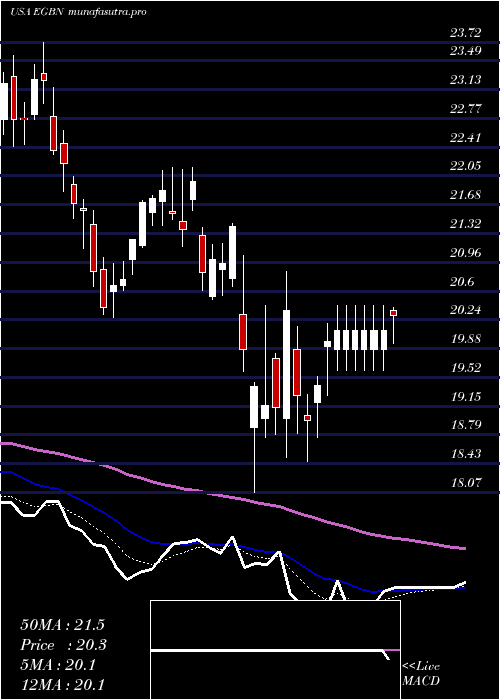
Daily price and charts and targets EagleBancorp Strong Daily Stock price targets for EagleBancorp EGBN are 21.13 and 22.11 | Daily Target 1 | 20.32 | | Daily Target 2 | 20.95 | | Daily Target 3 | 21.296666666667 | | Daily Target 4 | 21.93 | | Daily Target 5 | 22.28 |
Daily price and volume Eagle Bancorp
| Date |
Closing |
Open |
Range |
Volume |
Thu 04 December 2025 |
21.59 (4.1%) |
20.66 |
20.66 - 21.64 |
1.5178 times |
Wed 03 December 2025 |
20.74 (4.38%) |
19.95 |
19.77 - 20.87 |
1.1468 times |
Tue 02 December 2025 |
19.87 (0.56%) |
19.76 |
19.65 - 20.25 |
1.0264 times |
Mon 01 December 2025 |
19.76 (4.16%) |
18.82 |
18.82 - 19.80 |
0.8478 times |
Fri 28 November 2025 |
18.97 (0.37%) |
18.84 |
18.82 - 19.13 |
0.5997 times |
Wed 26 November 2025 |
18.90 (0.91%) |
18.58 |
18.58 - 19.12 |
0.885 times |
Tue 25 November 2025 |
18.73 (2.52%) |
18.30 |
18.30 - 19.03 |
1.0975 times |
Mon 24 November 2025 |
18.27 (1.73%) |
17.86 |
17.75 - 18.46 |
1.148 times |
Fri 21 November 2025 |
17.96 (5.15%) |
17.14 |
17.12 - 18.28 |
0.871 times |
Thu 20 November 2025 |
17.08 (0.23%) |
17.20 |
16.90 - 17.50 |
0.8601 times |
Wed 19 November 2025 |
17.04 (1.73%) |
16.76 |
16.64 - 17.08 |
0.7146 times |
Weekly price and charts EagleBancorp Strong weekly Stock price targets for EagleBancorp EGBN are 20.21 and 23.03 | Weekly Target 1 | 17.86 | | Weekly Target 2 | 19.73 | | Weekly Target 3 | 20.683333333333 | | Weekly Target 4 | 22.55 | | Weekly Target 5 | 23.5 |
Weekly price and volumes for Eagle Bancorp
| Date |
Closing |
Open |
Range |
Volume |
Thu 04 December 2025 |
21.59 (13.81%) |
18.82 |
18.82 - 21.64 |
1.1938 times |
Fri 28 November 2025 |
18.97 (5.62%) |
17.86 |
17.75 - 19.13 |
0.9811 times |
Fri 21 November 2025 |
17.96 (7.8%) |
16.59 |
15.58 - 18.28 |
1.2347 times |
Fri 14 November 2025 |
16.66 (0.48%) |
16.65 |
16.10 - 16.97 |
0.9988 times |
Fri 07 November 2025 |
16.58 (-1.01%) |
16.45 |
15.03 - 17.00 |
1.1384 times |
Fri 31 October 2025 |
16.75 (0%) |
16.59 |
16.17 - 16.78 |
0.1933 times |
Fri 31 October 2025 |
16.75 (-3.9%) |
17.44 |
16.17 - 17.94 |
1.1449 times |
Fri 24 October 2025 |
17.43 (-7.68%) |
19.01 |
16.78 - 19.67 |
1.4637 times |
Fri 17 October 2025 |
18.88 (-6.67%) |
20.69 |
18.36 - 21.42 |
0.7809 times |
Fri 10 October 2025 |
20.23 (-3.48%) |
21.28 |
20.20 - 22.19 |
0.8705 times |
Fri 03 October 2025 |
20.96 (0.43%) |
20.99 |
19.64 - 21.14 |
0.7346 times |

Monthly price and charts EagleBancorp Strong monthly Stock price targets for EagleBancorp EGBN are 20.21 and 23.03 | Monthly Target 1 | 17.86 | | Monthly Target 2 | 19.73 | | Monthly Target 3 | 20.683333333333 | | Monthly Target 4 | 22.55 | | Monthly Target 5 | 23.5 |
Monthly price and volumes Eagle Bancorp
| Date |
Closing |
Open |
Range |
Volume |
Thu 04 December 2025 |
21.59 (13.81%) |
18.82 |
18.82 - 21.64 |
0.3017 times |
Fri 28 November 2025 |
18.97 (13.25%) |
16.45 |
15.03 - 19.13 |
1.1001 times |
Fri 31 October 2025 |
16.75 (-17.16%) |
20.21 |
16.17 - 22.19 |
1.2279 times |
Tue 30 September 2025 |
20.22 (4.12%) |
19.09 |
18.90 - 21.61 |
1.2137 times |
Fri 29 August 2025 |
19.42 (20.7%) |
15.84 |
15.47 - 19.57 |
1.4042 times |
Thu 31 July 2025 |
16.09 (-17.4%) |
19.33 |
15.74 - 21.87 |
1.3875 times |
Mon 30 June 2025 |
19.48 (10.68%) |
17.57 |
16.68 - 19.72 |
0.9869 times |
Fri 30 May 2025 |
17.60 (-1.95%) |
17.92 |
17.01 - 19.58 |
0.5878 times |
Wed 30 April 2025 |
17.95 (-14.52%) |
20.87 |
16.85 - 21.45 |
1.1769 times |
Mon 31 March 2025 |
21.00 (-9.72%) |
23.33 |
20.27 - 23.72 |
0.6134 times |
Fri 28 February 2025 |
23.26 (-11.26%) |
25.37 |
22.41 - 27.07 |
0.9786 times |

DMA SMA EMA moving averages of Eagle Bancorp EGBN
DMA (daily moving average) of Eagle Bancorp EGBN
| DMA period | DMA value | | 5 day DMA | 20.19 | | 12 day DMA | 18.81 | | 20 day DMA | 17.83 | | 35 day DMA | 17.77 | | 50 day DMA | 18.66 | | 100 day DMA | 18.84 | | 150 day DMA | 18.78 | | 200 day DMA | 19.28 | EMA (exponential moving average) of Eagle Bancorp EGBN
| EMA period | EMA current | EMA prev | EMA prev2 | | 5 day EMA | 20.36 | 19.74 | 19.24 | | 12 day EMA | 19.19 | 18.75 | 18.39 | | 20 day EMA | 18.64 | 18.33 | 18.08 | | 35 day EMA | 18.71 | 18.54 | 18.41 | | 50 day EMA | 19.02 | 18.92 | 18.85 |
SMA (simple moving average) of Eagle Bancorp EGBN
| SMA period | SMA current | SMA prev | SMA prev2 | | 5 day SMA | 20.19 | 19.65 | 19.25 | | 12 day SMA | 18.81 | 18.32 | 17.98 | | 20 day SMA | 17.83 | 17.58 | 17.36 | | 35 day SMA | 17.77 | 17.73 | 17.75 | | 50 day SMA | 18.66 | 18.65 | 18.66 | | 100 day SMA | 18.84 | 18.84 | 18.85 | | 150 day SMA | 18.78 | 18.75 | 18.74 | | 200 day SMA | 19.28 | 19.29 | 19.31 |
|
|
