EquifaxInc EFX full analysis,charts,indicators,moving averages,SMA,DMA,EMA,ADX,MACD,RSIEquifax Inc EFX WideScreen charts, DMA,SMA,EMA technical analysis, forecast prediction, by indicators ADX,MACD,RSI,CCI USA stock exchange
operates under Finance sector & deals in Finance Consumer Services
Daily price and charts and targets EquifaxInc Strong Daily Stock price targets for EquifaxInc EFX are 210.6 and 214.97 | Daily Target 1 | 207.45 | | Daily Target 2 | 209.37 | | Daily Target 3 | 211.82333333333 | | Daily Target 4 | 213.74 | | Daily Target 5 | 216.19 |
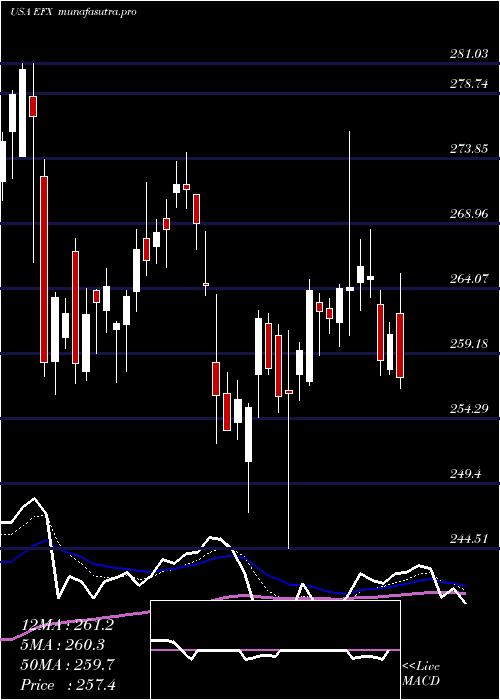
Daily price and volume Equifax Inc
| Date |
Closing |
Open |
Range |
Volume |
Thu 04 December 2025 |
211.28 (0.73%) |
211.27 |
209.91 - 214.28 |
1.7845 times |
Wed 03 December 2025 |
209.75 (0.52%) |
210.55 |
209.66 - 212.62 |
0.9426 times |
Tue 02 December 2025 |
208.67 (-0.13%) |
209.62 |
207.70 - 210.72 |
1.1164 times |
Mon 01 December 2025 |
208.94 (-1.62%) |
210.29 |
208.93 - 213.49 |
1.1142 times |
Fri 28 November 2025 |
212.37 (-0.16%) |
212.74 |
211.31 - 214.60 |
0.4801 times |
Wed 26 November 2025 |
212.70 (-1.01%) |
213.41 |
212.68 - 215.87 |
0.9994 times |
Tue 25 November 2025 |
214.88 (2.51%) |
209.86 |
209.86 - 216.10 |
0.6748 times |
Mon 24 November 2025 |
209.62 (-1.92%) |
214.15 |
208.61 - 214.73 |
0.9573 times |
Fri 21 November 2025 |
213.73 (3.43%) |
207.30 |
207.00 - 216.00 |
1.0461 times |
Thu 20 November 2025 |
206.65 (0.19%) |
208.37 |
204.76 - 209.49 |
0.8845 times |
Wed 19 November 2025 |
206.26 (0.85%) |
204.94 |
201.56 - 207.44 |
0.8638 times |
Weekly price and charts EquifaxInc Strong weekly Stock price targets for EquifaxInc EFX are 209.49 and 216.07 | Weekly Target 1 | 204.51 | | Weekly Target 2 | 207.89 | | Weekly Target 3 | 211.08666666667 | | Weekly Target 4 | 214.47 | | Weekly Target 5 | 217.67 |
Weekly price and volumes for Equifax Inc
| Date |
Closing |
Open |
Range |
Volume |
Thu 04 December 2025 |
211.28 (-0.51%) |
210.29 |
207.70 - 214.28 |
1.3492 times |
Fri 28 November 2025 |
212.37 (-0.64%) |
214.15 |
208.61 - 216.10 |
0.8468 times |
Fri 21 November 2025 |
213.73 (3.18%) |
207.87 |
201.56 - 216.00 |
1.1655 times |
Fri 14 November 2025 |
207.15 (-0.24%) |
208.43 |
204.10 - 213.09 |
1.0768 times |
Fri 07 November 2025 |
207.65 (-1.63%) |
210.22 |
202.00 - 211.04 |
1.0734 times |
Fri 31 October 2025 |
211.10 (0%) |
210.58 |
208.83 - 213.69 |
0.2954 times |
Fri 31 October 2025 |
211.10 (-9.71%) |
238.94 |
208.83 - 238.94 |
1.2281 times |
Fri 24 October 2025 |
233.80 (3.04%) |
230.00 |
219.56 - 236.49 |
1.0323 times |
Fri 17 October 2025 |
226.91 (-1.47%) |
230.81 |
221.58 - 231.60 |
0.9722 times |
Fri 10 October 2025 |
230.30 (-2.69%) |
236.70 |
229.07 - 244.37 |
0.9603 times |
Fri 03 October 2025 |
236.67 (-6.92%) |
255.69 |
216.00 - 258.40 |
1.34 times |
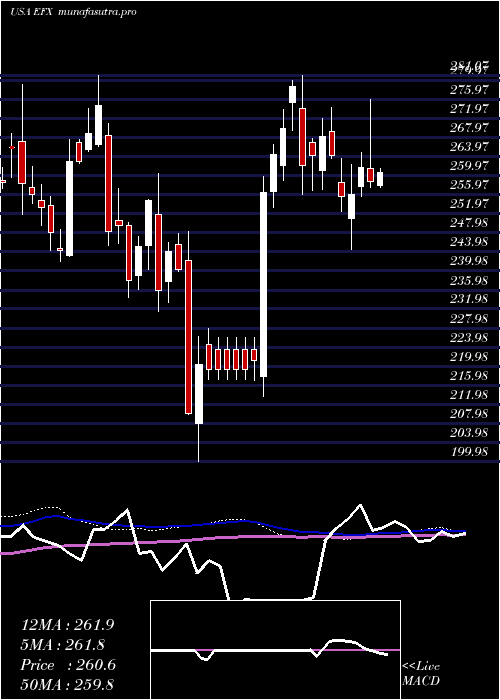
Monthly price and charts EquifaxInc Strong monthly Stock price targets for EquifaxInc EFX are 209.49 and 216.07 | Monthly Target 1 | 204.51 | | Monthly Target 2 | 207.89 | | Monthly Target 3 | 211.08666666667 | | Monthly Target 4 | 214.47 | | Monthly Target 5 | 217.67 |
Monthly price and volumes Equifax Inc
| Date |
Closing |
Open |
Range |
Volume |
Thu 04 December 2025 |
211.28 (-0.51%) |
210.29 |
207.70 - 214.28 |
0.3668 times |
Fri 28 November 2025 |
212.37 (0.6%) |
210.22 |
201.56 - 216.10 |
1.1317 times |
Fri 31 October 2025 |
211.10 (-17.71%) |
255.50 |
208.83 - 258.32 |
1.5076 times |
Tue 30 September 2025 |
256.53 (4.15%) |
241.73 |
233.74 - 271.84 |
1.0087 times |
Fri 29 August 2025 |
246.30 (2.53%) |
240.28 |
233.24 - 257.21 |
0.9847 times |
Thu 31 July 2025 |
240.23 (-7.38%) |
257.06 |
236.20 - 275.91 |
1.1412 times |
Mon 30 June 2025 |
259.37 (-1.82%) |
260.98 |
244.51 - 274.33 |
0.8093 times |
Fri 30 May 2025 |
264.19 (1.56%) |
258.73 |
256.07 - 281.03 |
0.8861 times |
Wed 30 April 2025 |
260.13 (6.8%) |
243.56 |
199.98 - 260.80 |
1.1748 times |
Mon 31 March 2025 |
243.56 (-0.67%) |
245.22 |
231.40 - 260.53 |
0.9891 times |
Fri 28 February 2025 |
245.20 (-10.76%) |
268.42 |
234.32 - 270.87 |
1.1579 times |
DMA SMA EMA moving averages of Equifax Inc EFX
DMA (daily moving average) of Equifax Inc EFX
| DMA period | DMA value | | 5 day DMA | 210.2 | | 12 day DMA | 209.95 | | 20 day DMA | 209 | | 35 day DMA | 214.51 | | 50 day DMA | 222.22 | | 100 day DMA | 235.58 | | 150 day DMA | 245.24 | | 200 day DMA | 242.99 | EMA (exponential moving average) of Equifax Inc EFX
| EMA period | EMA current | EMA prev | EMA prev2 | | 5 day EMA | 210.43 | 210.01 | 210.14 | | 12 day EMA | 210.35 | 210.18 | 210.26 | | 20 day EMA | 211.69 | 211.73 | 211.94 | | 35 day EMA | 217.56 | 217.93 | 218.41 | | 50 day EMA | 223.95 | 224.47 | 225.07 |
SMA (simple moving average) of Equifax Inc EFX
| SMA period | SMA current | SMA prev | SMA prev2 | | 5 day SMA | 210.2 | 210.49 | 211.51 | | 12 day SMA | 209.95 | 209.41 | 209.2 | | 20 day SMA | 209 | 208.8 | 208.73 | | 35 day SMA | 214.51 | 215.04 | 215.57 | | 50 day SMA | 222.22 | 223.14 | 224.1 | | 100 day SMA | 235.58 | 236.04 | 236.55 | | 150 day SMA | 245.24 | 245.56 | 245.89 | | 200 day SMA | 242.99 | 243.14 | 243.3 |
|
|
