GlobalX EFAS full analysis,charts,indicators,moving averages,SMA,DMA,EMA,ADX,MACD,RSIGlobal X EFAS WideScreen charts, DMA,SMA,EMA technical analysis, forecast prediction, by indicators ADX,MACD,RSI,CCI USA stock exchange
operates under N A sector & deals in N A
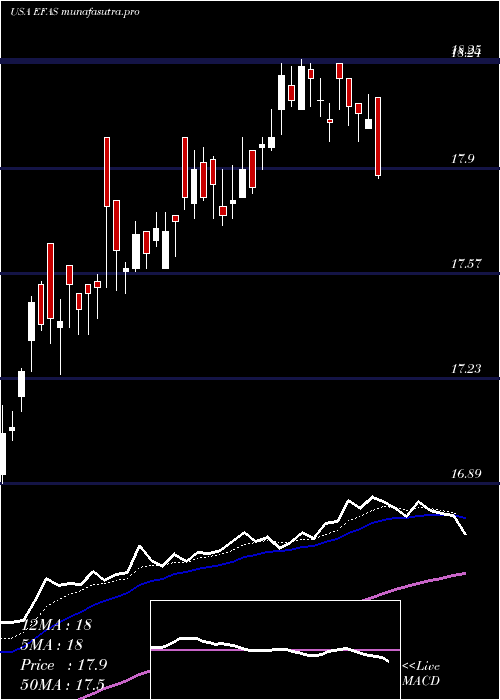
Daily price and charts and targets GlobalX Strong Daily Stock price targets for GlobalX EFAS are 18.54 and 18.69 | Daily Target 1 | 18.42 | | Daily Target 2 | 18.51 | | Daily Target 3 | 18.573333333333 | | Daily Target 4 | 18.66 | | Daily Target 5 | 18.72 |
Daily price and volume Global X
| Date |
Closing |
Open |
Range |
Volume |
Mon 20 October 2025 |
18.59 (0.16%) |
18.54 |
18.49 - 18.64 |
0.9739 times |
Fri 17 October 2025 |
18.56 (0.11%) |
18.49 |
18.42 - 18.61 |
0.7631 times |
Thu 16 October 2025 |
18.54 (0.16%) |
18.47 |
18.41 - 18.57 |
0.4468 times |
Wed 15 October 2025 |
18.51 (-0.54%) |
18.62 |
18.47 - 18.62 |
0.5723 times |
Tue 14 October 2025 |
18.61 (1.09%) |
18.49 |
18.44 - 18.62 |
0.6275 times |
Mon 13 October 2025 |
18.41 (0.33%) |
18.31 |
18.31 - 18.46 |
1.3705 times |
Fri 10 October 2025 |
18.35 (-0.7%) |
18.55 |
18.27 - 18.57 |
1.4458 times |
Thu 09 October 2025 |
18.48 (-0.59%) |
18.57 |
18.45 - 18.84 |
0.8534 times |
Wed 08 October 2025 |
18.59 (0.16%) |
18.59 |
18.51 - 18.61 |
1.24 times |
Tue 07 October 2025 |
18.56 (-2.06%) |
18.70 |
18.51 - 18.70 |
1.7068 times |
Mon 06 October 2025 |
18.95 (0.85%) |
18.62 |
18.62 - 18.95 |
0.9883 times |
Weekly price and charts GlobalX Strong weekly Stock price targets for GlobalX EFAS are 18.54 and 18.69 | Weekly Target 1 | 18.42 | | Weekly Target 2 | 18.51 | | Weekly Target 3 | 18.573333333333 | | Weekly Target 4 | 18.66 | | Weekly Target 5 | 18.72 |
Weekly price and volumes for Global X
| Date |
Closing |
Open |
Range |
Volume |
Mon 20 October 2025 |
18.59 (0.16%) |
18.54 |
18.49 - 18.64 |
0.2133 times |
Fri 17 October 2025 |
18.56 (1.14%) |
18.31 |
18.31 - 18.62 |
0.8278 times |
Fri 10 October 2025 |
18.35 (-2.34%) |
18.62 |
18.27 - 18.95 |
1.3652 times |
Fri 03 October 2025 |
18.79 (-0.74%) |
18.97 |
18.73 - 19.00 |
1.1025 times |
Fri 26 September 2025 |
18.93 (-0.37%) |
18.93 |
18.64 - 18.99 |
1.4412 times |
Fri 19 September 2025 |
19.00 (-0.84%) |
19.16 |
18.92 - 19.34 |
1.5137 times |
Fri 12 September 2025 |
19.16 (2.19%) |
18.71 |
18.71 - 19.23 |
1.2037 times |
Fri 05 September 2025 |
18.75 (-0.32%) |
18.70 |
18.45 - 18.95 |
1.0575 times |
Fri 29 August 2025 |
18.81 (0%) |
18.83 |
18.80 - 18.85 |
0.1836 times |
Fri 29 August 2025 |
18.81 (-2.74%) |
19.19 |
18.74 - 19.28 |
1.0916 times |
Fri 22 August 2025 |
19.34 (0.94%) |
19.49 |
18.92 - 19.49 |
1.4324 times |
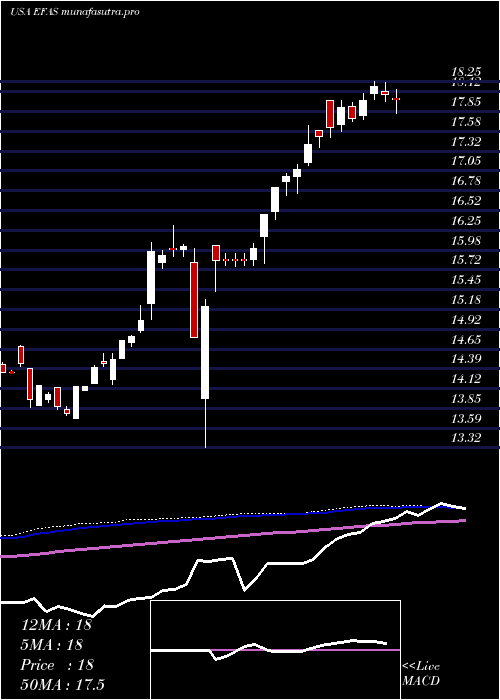
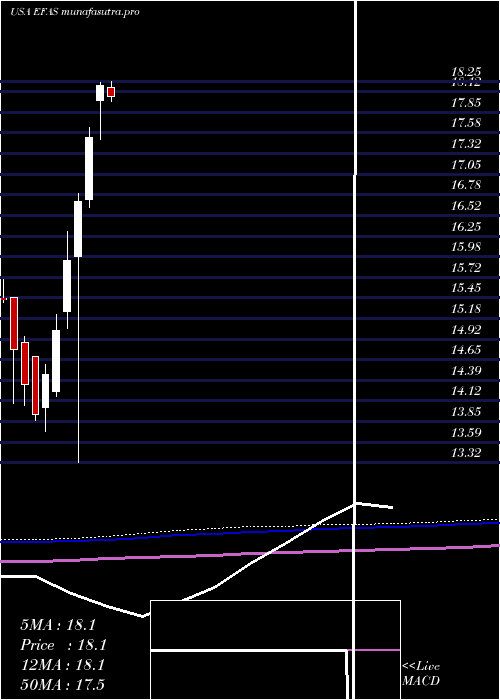
Monthly price and charts GlobalX Strong monthly Stock price targets for GlobalX EFAS are 18.07 and 18.8 | Monthly Target 1 | 17.89 | | Monthly Target 2 | 18.24 | | Monthly Target 3 | 18.62 | | Monthly Target 4 | 18.97 | | Monthly Target 5 | 19.35 |
Monthly price and volumes Global X
| Date |
Closing |
Open |
Range |
Volume |
Mon 20 October 2025 |
18.59 (-1.64%) |
18.93 |
18.27 - 19.00 |
0.8383 times |
Tue 30 September 2025 |
18.90 (0.48%) |
18.70 |
18.45 - 19.34 |
1.5187 times |
Fri 29 August 2025 |
18.81 (3.29%) |
18.17 |
18.10 - 19.49 |
1.3441 times |
Thu 31 July 2025 |
18.21 (0.05%) |
18.17 |
17.82 - 18.73 |
1.6605 times |
Mon 30 June 2025 |
18.20 (3.88%) |
18.00 |
17.50 - 18.24 |
1.8347 times |
Fri 30 May 2025 |
17.52 (4.91%) |
16.72 |
16.62 - 17.66 |
1.0424 times |
Wed 30 April 2025 |
16.70 (4.77%) |
15.99 |
13.32 - 16.80 |
0.9479 times |
Mon 31 March 2025 |
15.94 (6.05%) |
15.27 |
15.05 - 16.31 |
0.6031 times |
Fri 28 February 2025 |
15.03 (3.94%) |
14.24 |
14.18 - 15.24 |
0.1265 times |
Fri 31 January 2025 |
14.46 (3.73%) |
14.04 |
13.72 - 14.59 |
0.0838 times |
Tue 31 December 2024 |
13.94 (-2.72%) |
14.69 |
13.87 - 14.70 |
0.0542 times |
DMA SMA EMA moving averages of Global X EFAS
DMA (daily moving average) of Global X EFAS
| DMA period | DMA value | | 5 day DMA | 18.56 | | 12 day DMA | 18.58 | | 20 day DMA | 18.69 | | 35 day DMA | 18.81 | | 50 day DMA | 18.88 | | 100 day DMA | 18.47 | | 150 day DMA | 17.73 | | 200 day DMA | 16.97 | EMA (exponential moving average) of Global X EFAS
| EMA period | EMA current | EMA prev | EMA prev2 | | 5 day EMA | 18.56 | 18.54 | 18.53 | | 12 day EMA | 18.61 | 18.61 | 18.62 | | 20 day EMA | 18.67 | 18.68 | 18.69 | | 35 day EMA | 18.74 | 18.75 | 18.76 | | 50 day EMA | 18.84 | 18.85 | 18.86 |
SMA (simple moving average) of Global X EFAS
| SMA period | SMA current | SMA prev | SMA prev2 | | 5 day SMA | 18.56 | 18.53 | 18.48 | | 12 day SMA | 18.58 | 18.59 | 18.63 | | 20 day SMA | 18.69 | 18.71 | 18.73 | | 35 day SMA | 18.81 | 18.81 | 18.82 | | 50 day SMA | 18.88 | 18.88 | 18.89 | | 100 day SMA | 18.47 | 18.46 | 18.45 | | 150 day SMA | 17.73 | 17.72 | 17.7 | | 200 day SMA | 16.97 | 16.95 | 16.93 |
|
|
