ElPaso EE full analysis,charts,indicators,moving averages,SMA,DMA,EMA,ADX,MACD,RSIEl Paso EE WideScreen charts, DMA,SMA,EMA technical analysis, forecast prediction, by indicators ADX,MACD,RSI,CCI USA stock exchange
operates under Public Utilities sector & deals in Electric Utilities Central
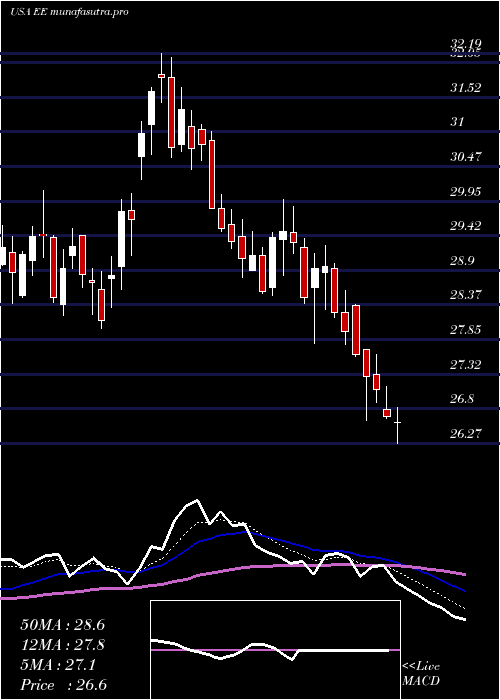
Daily price and charts and targets ElPaso Strong Daily Stock price targets for ElPaso EE are 27.56 and 28.62 | Daily Target 1 | 26.73 | | Daily Target 2 | 27.32 | | Daily Target 3 | 27.79 | | Daily Target 4 | 28.38 | | Daily Target 5 | 28.85 |
Daily price and volume El Paso
| Date |
Closing |
Open |
Range |
Volume |
Mon 20 October 2025 |
27.91 (2.16%) |
27.60 |
27.20 - 28.26 |
1.26 times |
Fri 17 October 2025 |
27.32 (-3.02%) |
28.05 |
27.12 - 28.29 |
0.8838 times |
Thu 16 October 2025 |
28.17 (-0.6%) |
28.59 |
27.91 - 28.97 |
0.7131 times |
Wed 15 October 2025 |
28.34 (2.98%) |
27.72 |
27.72 - 28.46 |
1.2715 times |
Tue 14 October 2025 |
27.52 (0.36%) |
27.01 |
26.90 - 27.80 |
1.0764 times |
Mon 13 October 2025 |
27.42 (1.74%) |
27.13 |
26.77 - 27.56 |
0.8427 times |
Fri 10 October 2025 |
26.95 (-2.14%) |
27.38 |
26.90 - 27.73 |
0.8236 times |
Thu 09 October 2025 |
27.54 (-0.58%) |
27.58 |
27.13 - 27.88 |
1.2801 times |
Wed 08 October 2025 |
27.70 (3.13%) |
26.81 |
26.04 - 27.73 |
0.9424 times |
Tue 07 October 2025 |
26.86 (3.31%) |
26.00 |
25.71 - 27.02 |
0.9064 times |
Mon 06 October 2025 |
26.00 (0.46%) |
25.89 |
25.36 - 27.74 |
0.7394 times |
Weekly price and charts ElPaso Strong weekly Stock price targets for ElPaso EE are 27.56 and 28.62 | Weekly Target 1 | 26.73 | | Weekly Target 2 | 27.32 | | Weekly Target 3 | 27.79 | | Weekly Target 4 | 28.38 | | Weekly Target 5 | 28.85 |
Weekly price and volumes for El Paso
| Date |
Closing |
Open |
Range |
Volume |
Mon 20 October 2025 |
27.91 (2.16%) |
27.60 |
27.20 - 28.26 |
0.4335 times |
Fri 17 October 2025 |
27.32 (1.37%) |
27.13 |
26.77 - 28.97 |
1.6473 times |
Fri 10 October 2025 |
26.95 (4.13%) |
25.89 |
25.36 - 27.88 |
1.6144 times |
Fri 03 October 2025 |
25.88 (2.29%) |
25.41 |
24.63 - 25.94 |
1.0719 times |
Fri 26 September 2025 |
25.30 (5.29%) |
23.91 |
23.69 - 25.74 |
1.2838 times |
Fri 19 September 2025 |
24.03 (-0.08%) |
23.90 |
23.55 - 24.70 |
0.9085 times |
Fri 12 September 2025 |
24.05 (1.48%) |
23.85 |
22.86 - 24.12 |
0.9358 times |
Fri 05 September 2025 |
23.70 (-2.95%) |
24.30 |
23.23 - 24.55 |
0.9298 times |
Fri 29 August 2025 |
24.42 (0%) |
24.80 |
24.34 - 24.81 |
0.1672 times |
Fri 29 August 2025 |
24.42 (-0.37%) |
24.42 |
23.97 - 25.17 |
1.0076 times |
Fri 22 August 2025 |
24.51 (2.38%) |
23.88 |
23.28 - 24.63 |
1.5146 times |
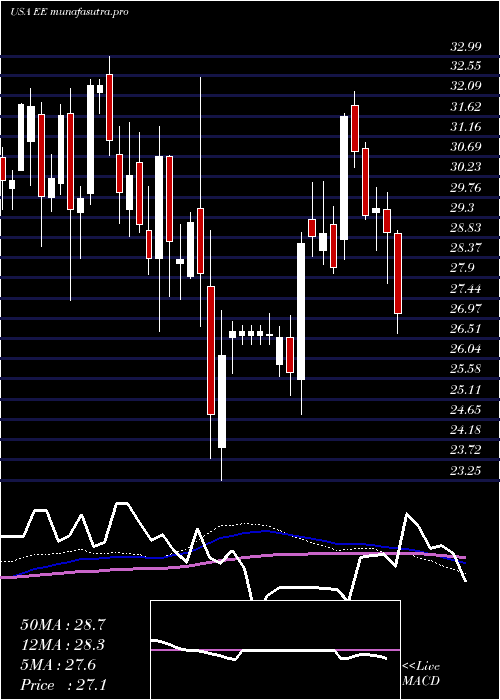
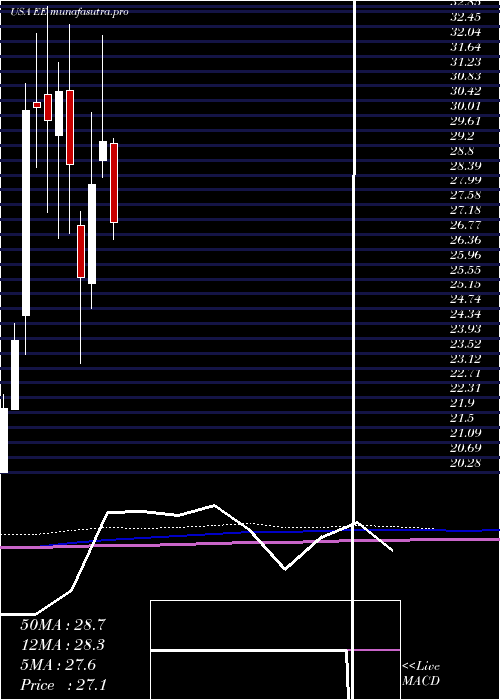
Monthly price and charts ElPaso Strong monthly Stock price targets for ElPaso EE are 26.38 and 30.5 | Monthly Target 1 | 23.12 | | Monthly Target 2 | 25.52 | | Monthly Target 3 | 27.243333333333 | | Monthly Target 4 | 29.64 | | Monthly Target 5 | 31.36 |
Monthly price and volumes El Paso
| Date |
Closing |
Open |
Range |
Volume |
Mon 20 October 2025 |
27.91 (10.8%) |
25.06 |
24.85 - 28.97 |
0.8599 times |
Tue 30 September 2025 |
25.19 (3.15%) |
24.30 |
22.86 - 25.74 |
0.9258 times |
Fri 29 August 2025 |
24.42 (-4.83%) |
25.78 |
21.28 - 25.83 |
1.3308 times |
Thu 31 July 2025 |
25.66 (-12.48%) |
29.24 |
23.70 - 29.38 |
1.2736 times |
Mon 30 June 2025 |
29.32 (4.23%) |
28.78 |
28.33 - 32.19 |
1.0187 times |
Fri 30 May 2025 |
28.13 (9.97%) |
25.43 |
24.76 - 30.11 |
0.9447 times |
Wed 30 April 2025 |
25.58 (-10.81%) |
27.00 |
23.25 - 27.41 |
1.9548 times |
Mon 31 March 2025 |
28.68 (-6.52%) |
30.70 |
26.79 - 32.50 |
0.6586 times |
Fri 28 February 2025 |
30.68 (2.71%) |
29.48 |
26.66 - 31.47 |
0.4697 times |
Fri 31 January 2025 |
29.87 (-1.26%) |
30.58 |
27.38 - 32.99 |
0.5635 times |
Tue 31 December 2024 |
30.25 (0.33%) |
30.36 |
28.61 - 32.25 |
0.4517 times |
DMA SMA EMA moving averages of El Paso EE
DMA (daily moving average) of El Paso EE
| DMA period | DMA value | | 5 day DMA | 27.85 | | 12 day DMA | 27.3 | | 20 day DMA | 26.44 | | 35 day DMA | 25.29 | | 50 day DMA | 24.98 | | 100 day DMA | 26.32 | | 150 day DMA | 26.67 | | 200 day DMA | 27.48 | EMA (exponential moving average) of El Paso EE
| EMA period | EMA current | EMA prev | EMA prev2 | | 5 day EMA | 27.72 | 27.63 | 27.79 | | 12 day EMA | 27.2 | 27.07 | 27.03 | | 20 day EMA | 26.62 | 26.48 | 26.39 | | 35 day EMA | 25.92 | 25.8 | 25.71 | | 50 day EMA | 25.22 | 25.11 | 25.02 |
SMA (simple moving average) of El Paso EE
| SMA period | SMA current | SMA prev | SMA prev2 | | 5 day SMA | 27.85 | 27.75 | 27.68 | | 12 day SMA | 27.3 | 27.06 | 26.91 | | 20 day SMA | 26.44 | 26.25 | 26.09 | | 35 day SMA | 25.29 | 25.19 | 25.11 | | 50 day SMA | 24.98 | 24.9 | 24.84 | | 100 day SMA | 26.32 | 26.33 | 26.34 | | 150 day SMA | 26.67 | 26.67 | 26.68 | | 200 day SMA | 27.48 | 27.5 | 27.52 |
|
|
