NewOriental EDU full analysis,charts,indicators,moving averages,SMA,DMA,EMA,ADX,MACD,RSINew Oriental EDU WideScreen charts, DMA,SMA,EMA technical analysis, forecast prediction, by indicators ADX,MACD,RSI,CCI USA stock exchange
operates under Consumer Services sector & deals in Other Consumer Services
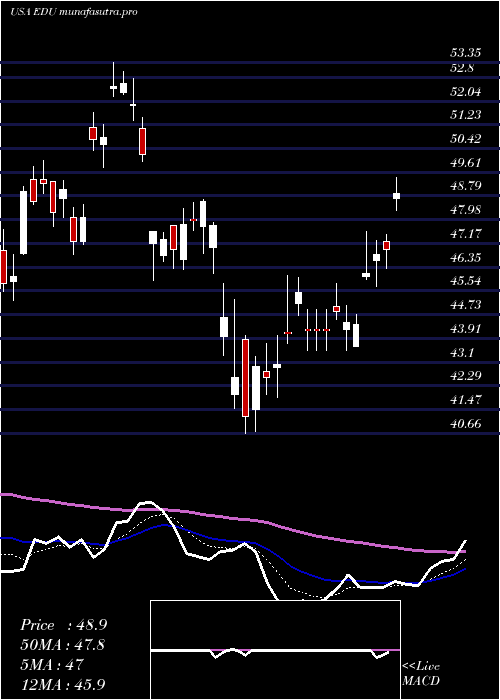
Daily price and charts and targets NewOriental Strong Daily Stock price targets for NewOriental EDU are 59.47 and 62.46 | Daily Target 1 | 57.06 | | Daily Target 2 | 58.88 | | Daily Target 3 | 60.046666666667 | | Daily Target 4 | 61.87 | | Daily Target 5 | 63.04 |
Daily price and volume New Oriental
| Date |
Closing |
Open |
Range |
Volume |
Tue 21 October 2025 |
60.71 (4.67%) |
58.64 |
58.22 - 61.21 |
1.0847 times |
Mon 20 October 2025 |
58.00 (2.06%) |
56.55 |
56.34 - 58.10 |
0.5795 times |
Fri 17 October 2025 |
56.83 (2.49%) |
55.57 |
55.14 - 57.04 |
1.406 times |
Thu 16 October 2025 |
55.45 (-5.1%) |
57.95 |
55.38 - 58.02 |
0.8546 times |
Wed 15 October 2025 |
58.43 (10.5%) |
54.53 |
54.44 - 58.69 |
1.8062 times |
Tue 14 October 2025 |
52.88 (0.36%) |
51.93 |
51.32 - 53.26 |
0.5916 times |
Mon 13 October 2025 |
52.69 (2.45%) |
51.24 |
51.12 - 52.84 |
0.7504 times |
Fri 10 October 2025 |
51.43 (-3.91%) |
53.60 |
50.88 - 53.85 |
2.0547 times |
Thu 09 October 2025 |
53.52 (0.24%) |
53.50 |
52.62 - 53.69 |
0.4137 times |
Wed 08 October 2025 |
53.39 (3.03%) |
52.45 |
52.39 - 53.41 |
0.4586 times |
Tue 07 October 2025 |
51.82 (-1.45%) |
53.00 |
51.74 - 53.00 |
0.361 times |
Weekly price and charts NewOriental Strong weekly Stock price targets for NewOriental EDU are 58.53 and 63.4 | Weekly Target 1 | 54.55 | | Weekly Target 2 | 57.63 | | Weekly Target 3 | 59.42 | | Weekly Target 4 | 62.5 | | Weekly Target 5 | 64.29 |
Weekly price and volumes for New Oriental
| Date |
Closing |
Open |
Range |
Volume |
Tue 21 October 2025 |
60.71 (6.83%) |
56.55 |
56.34 - 61.21 |
0.564 times |
Fri 17 October 2025 |
56.83 (10.5%) |
51.24 |
51.12 - 58.69 |
1.8331 times |
Fri 10 October 2025 |
51.43 (-1.83%) |
52.38 |
50.88 - 53.85 |
1.2997 times |
Fri 03 October 2025 |
52.39 (2.03%) |
54.52 |
52.08 - 55.91 |
0.7736 times |
Fri 26 September 2025 |
51.35 (-1%) |
51.55 |
50.02 - 53.29 |
0.9754 times |
Fri 19 September 2025 |
51.87 (-3.48%) |
54.04 |
51.86 - 54.69 |
1.2488 times |
Fri 12 September 2025 |
53.74 (10.08%) |
49.07 |
48.71 - 55.34 |
1.663 times |
Fri 05 September 2025 |
48.82 (1.75%) |
48.09 |
47.52 - 49.50 |
0.5145 times |
Fri 29 August 2025 |
47.98 (0%) |
47.23 |
47.00 - 48.41 |
0.2568 times |
Fri 29 August 2025 |
47.98 (0.73%) |
48.00 |
45.91 - 48.41 |
0.8711 times |
Fri 22 August 2025 |
47.63 (-1.59%) |
48.40 |
46.60 - 48.68 |
0.7309 times |
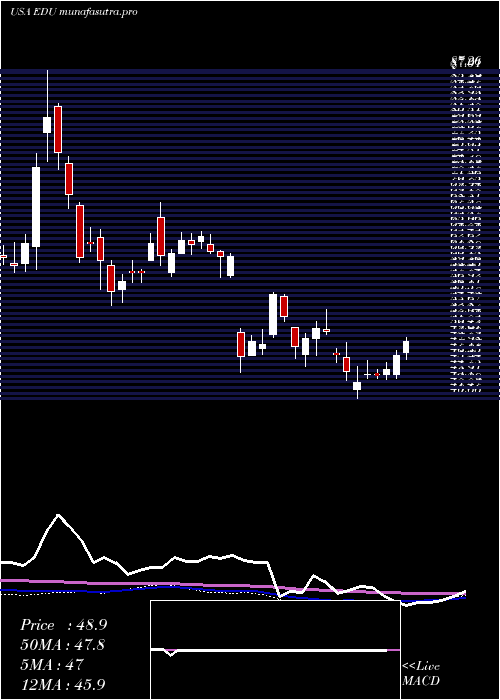
Monthly price and charts NewOriental Strong monthly Stock price targets for NewOriental EDU are 55.8 and 66.13 | Monthly Target 1 | 47.27 | | Monthly Target 2 | 53.99 | | Monthly Target 3 | 57.6 | | Monthly Target 4 | 64.32 | | Monthly Target 5 | 67.93 |
Monthly price and volumes New Oriental
| Date |
Closing |
Open |
Range |
Volume |
Tue 21 October 2025 |
60.71 (14.4%) |
53.46 |
50.88 - 61.21 |
0.6163 times |
Tue 30 September 2025 |
53.07 (10.61%) |
48.09 |
47.52 - 55.91 |
0.7493 times |
Fri 29 August 2025 |
47.98 (8.77%) |
43.66 |
43.27 - 49.18 |
0.695 times |
Thu 31 July 2025 |
44.11 (-18.24%) |
54.30 |
41.62 - 54.35 |
1.3743 times |
Mon 30 June 2025 |
53.95 (13.91%) |
46.27 |
44.90 - 56.05 |
0.7441 times |
Fri 30 May 2025 |
47.36 (-3.05%) |
49.12 |
45.74 - 50.40 |
0.5681 times |
Wed 30 April 2025 |
48.85 (2.18%) |
48.00 |
40.66 - 49.44 |
1.1059 times |
Mon 31 March 2025 |
47.81 (-0.56%) |
46.93 |
45.22 - 53.35 |
0.7919 times |
Fri 28 February 2025 |
48.08 (-1.39%) |
47.80 |
46.42 - 55.80 |
1.554 times |
Fri 31 January 2025 |
48.76 (-24.03%) |
62.69 |
44.46 - 64.38 |
1.801 times |
Tue 31 December 2024 |
64.18 (9.56%) |
60.30 |
58.09 - 68.53 |
0.8044 times |

DMA SMA EMA moving averages of New Oriental EDU
DMA (daily moving average) of New Oriental EDU
| DMA period | DMA value | | 5 day DMA | 57.88 | | 12 day DMA | 54.81 | | 20 day DMA | 53.83 | | 35 day DMA | 53.05 | | 50 day DMA | 51.41 | | 100 day DMA | 50.07 | | 150 day DMA | 49.11 | | 200 day DMA | 49.85 | EMA (exponential moving average) of New Oriental EDU
| EMA period | EMA current | EMA prev | EMA prev2 | | 5 day EMA | 57.8 | 56.35 | 55.52 | | 12 day EMA | 55.73 | 54.83 | 54.25 | | 20 day EMA | 54.54 | 53.89 | 53.46 | | 35 day EMA | 52.84 | 52.38 | 52.05 | | 50 day EMA | 51.61 | 51.24 | 50.96 |
SMA (simple moving average) of New Oriental EDU
| SMA period | SMA current | SMA prev | SMA prev2 | | 5 day SMA | 57.88 | 56.32 | 55.26 | | 12 day SMA | 54.81 | 54.12 | 53.74 | | 20 day SMA | 53.83 | 53.34 | 53.08 | | 35 day SMA | 53.05 | 52.72 | 52.43 | | 50 day SMA | 51.41 | 51.12 | 50.87 | | 100 day SMA | 50.07 | 49.94 | 49.83 | | 150 day SMA | 49.11 | 49.04 | 48.97 | | 200 day SMA | 49.85 | 49.86 | 49.89 |
|
|
