EdapTms EDAP full analysis,charts,indicators,moving averages,SMA,DMA,EMA,ADX,MACD,RSIEdap Tms EDAP WideScreen charts, DMA,SMA,EMA technical analysis, forecast prediction, by indicators ADX,MACD,RSI,CCI USA stock exchange
operates under Health Care sector & deals in Biotechnology Electromedical Electrotherapeutic Apparatus
Daily price and charts and targets EdapTms Strong Daily Stock price targets for EdapTms EDAP are 2.38 and 2.45 | Daily Target 1 | 2.32 | | Daily Target 2 | 2.36 | | Daily Target 3 | 2.39 | | Daily Target 4 | 2.43 | | Daily Target 5 | 2.46 |
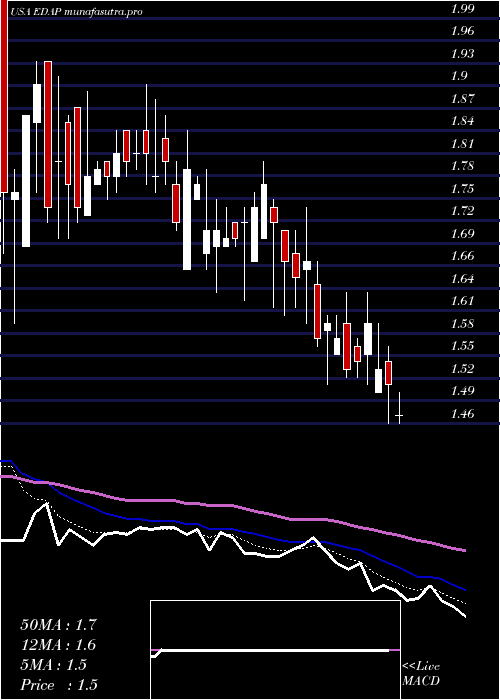
Daily price and volume Edap Tms
| Date |
Closing |
Open |
Range |
Volume |
Thu 04 December 2025 |
2.40 (-0.41%) |
2.35 |
2.35 - 2.42 |
0.2687 times |
Wed 03 December 2025 |
2.41 (4.78%) |
2.30 |
2.25 - 2.41 |
0.6676 times |
Tue 02 December 2025 |
2.30 (-1.29%) |
2.34 |
2.24 - 2.34 |
0.3241 times |
Mon 01 December 2025 |
2.33 (-2.92%) |
2.40 |
2.32 - 2.40 |
0.2853 times |
Fri 28 November 2025 |
2.40 (-1.23%) |
2.40 |
2.30 - 2.40 |
0.5374 times |
Wed 26 November 2025 |
2.43 (0.83%) |
2.36 |
2.36 - 2.45 |
0.4626 times |
Tue 25 November 2025 |
2.41 (8.56%) |
2.26 |
2.26 - 2.48 |
2.446 times |
Mon 24 November 2025 |
2.22 (-3.48%) |
2.34 |
2.21 - 2.34 |
0.3518 times |
Fri 21 November 2025 |
2.30 (-2.54%) |
2.44 |
2.28 - 2.44 |
0.7618 times |
Thu 20 November 2025 |
2.36 (5.83%) |
2.30 |
2.23 - 2.53 |
3.8947 times |
Wed 19 November 2025 |
2.23 (3.72%) |
2.20 |
2.12 - 2.27 |
1.1828 times |
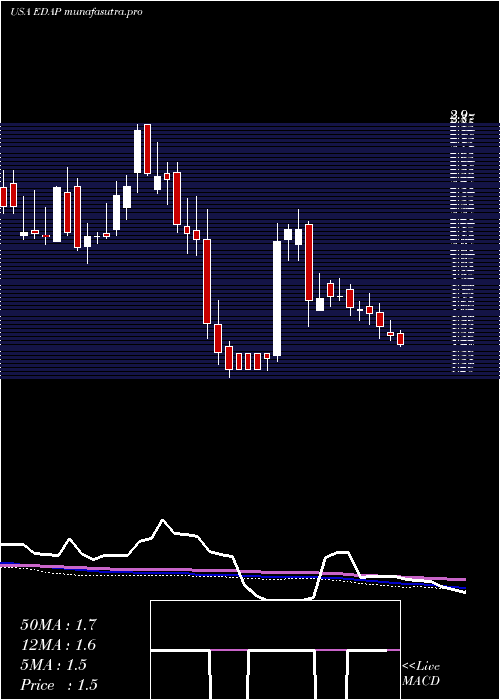
Weekly price and charts EdapTms Strong weekly Stock price targets for EdapTms EDAP are 2.31 and 2.49 | Weekly Target 1 | 2.17 | | Weekly Target 2 | 2.29 | | Weekly Target 3 | 2.3533333333333 | | Weekly Target 4 | 2.47 | | Weekly Target 5 | 2.53 |
Weekly price and volumes for Edap Tms
| Date |
Closing |
Open |
Range |
Volume |
Thu 04 December 2025 |
2.40 (0%) |
2.40 |
2.24 - 2.42 |
0.2376 times |
Fri 28 November 2025 |
2.40 (4.35%) |
2.34 |
2.21 - 2.48 |
0.5837 times |
Fri 21 November 2025 |
2.30 (9.52%) |
2.08 |
1.95 - 2.53 |
1.1354 times |
Fri 14 November 2025 |
2.10 (3.96%) |
2.00 |
1.82 - 2.17 |
1.1461 times |
Fri 07 November 2025 |
2.02 (-5.61%) |
2.02 |
1.95 - 2.24 |
0.7105 times |
Fri 31 October 2025 |
2.14 (0%) |
2.20 |
2.11 - 2.22 |
0.103 times |
Fri 31 October 2025 |
2.14 (-10.08%) |
2.35 |
1.75 - 2.41 |
1.6256 times |
Fri 24 October 2025 |
2.38 (6.25%) |
2.17 |
2.12 - 2.46 |
1.0698 times |
Fri 17 October 2025 |
2.24 (8.21%) |
2.08 |
2.08 - 2.79 |
2.7451 times |
Fri 10 October 2025 |
2.07 (-10.78%) |
2.30 |
2.02 - 2.33 |
0.6433 times |
Fri 03 October 2025 |
2.32 (-4.13%) |
2.42 |
2.22 - 2.50 |
0.7787 times |
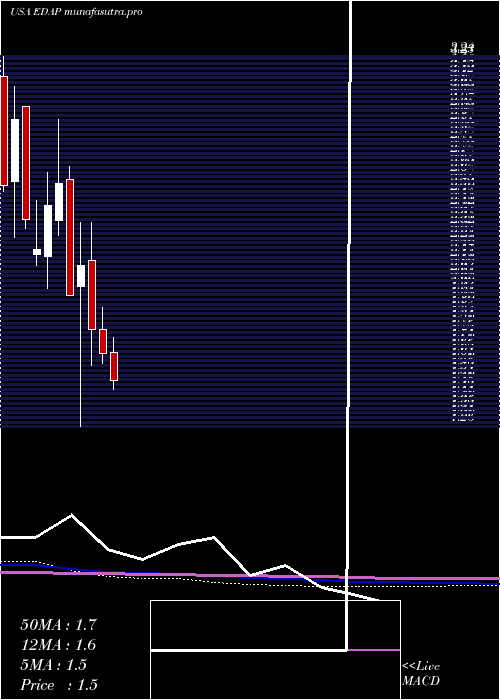
Monthly price and charts EdapTms Strong monthly Stock price targets for EdapTms EDAP are 2.31 and 2.49 | Monthly Target 1 | 2.17 | | Monthly Target 2 | 2.29 | | Monthly Target 3 | 2.3533333333333 | | Monthly Target 4 | 2.47 | | Monthly Target 5 | 2.53 |
Monthly price and volumes Edap Tms
| Date |
Closing |
Open |
Range |
Volume |
Thu 04 December 2025 |
2.40 (0%) |
2.40 |
2.24 - 2.42 |
0.0389 times |
Fri 28 November 2025 |
2.40 (12.15%) |
2.02 |
1.82 - 2.53 |
0.5858 times |
Fri 31 October 2025 |
2.14 (-6.55%) |
2.37 |
1.75 - 2.79 |
1.0921 times |
Tue 30 September 2025 |
2.29 (1.33%) |
2.24 |
2.22 - 3.05 |
1.4689 times |
Fri 29 August 2025 |
2.26 (61.43%) |
1.38 |
1.21 - 2.29 |
2.0974 times |
Thu 31 July 2025 |
1.40 (-15.15%) |
1.66 |
1.40 - 1.74 |
0.7929 times |
Mon 30 June 2025 |
1.65 (-7.3%) |
1.78 |
1.60 - 1.90 |
0.4628 times |
Fri 30 May 2025 |
1.78 (-16.04%) |
2.15 |
1.59 - 2.35 |
0.8513 times |
Wed 30 April 2025 |
2.12 (8.16%) |
2.01 |
1.26 - 2.35 |
1.993 times |
Mon 31 March 2025 |
1.96 (-23.44%) |
2.58 |
1.96 - 2.65 |
0.6167 times |
Fri 28 February 2025 |
2.56 (4.92%) |
2.36 |
2.28 - 2.90 |
0.5114 times |
DMA SMA EMA moving averages of Edap Tms EDAP
DMA (daily moving average) of Edap Tms EDAP
| DMA period | DMA value | | 5 day DMA | 2.37 | | 12 day DMA | 2.33 | | 20 day DMA | 2.22 | | 35 day DMA | 2.22 | | 50 day DMA | 2.24 | | 100 day DMA | 2.04 | | 150 day DMA | 1.96 | | 200 day DMA | 1.98 | EMA (exponential moving average) of Edap Tms EDAP
| EMA period | EMA current | EMA prev | EMA prev2 | | 5 day EMA | 2.37 | 2.36 | 2.33 | | 12 day EMA | 2.32 | 2.3 | 2.28 | | 20 day EMA | 2.28 | 2.27 | 2.25 | | 35 day EMA | 2.27 | 2.26 | 2.25 | | 50 day EMA | 2.28 | 2.27 | 2.26 |
SMA (simple moving average) of Edap Tms EDAP
| SMA period | SMA current | SMA prev | SMA prev2 | | 5 day SMA | 2.37 | 2.37 | 2.37 | | 12 day SMA | 2.33 | 2.3 | 2.28 | | 20 day SMA | 2.22 | 2.2 | 2.18 | | 35 day SMA | 2.22 | 2.23 | 2.22 | | 50 day SMA | 2.24 | 2.24 | 2.24 | | 100 day SMA | 2.04 | 2.03 | 2.02 | | 150 day SMA | 1.96 | 1.96 | 1.96 | | 200 day SMA | 1.98 | 1.98 | 1.98 |
|
|
