EncoreCapital ECPG full analysis,charts,indicators,moving averages,SMA,DMA,EMA,ADX,MACD,RSIEncore Capital ECPG WideScreen charts, DMA,SMA,EMA technical analysis, forecast prediction, by indicators ADX,MACD,RSI,CCI USA stock exchange
operates under Finance sector & deals in Finance Companies
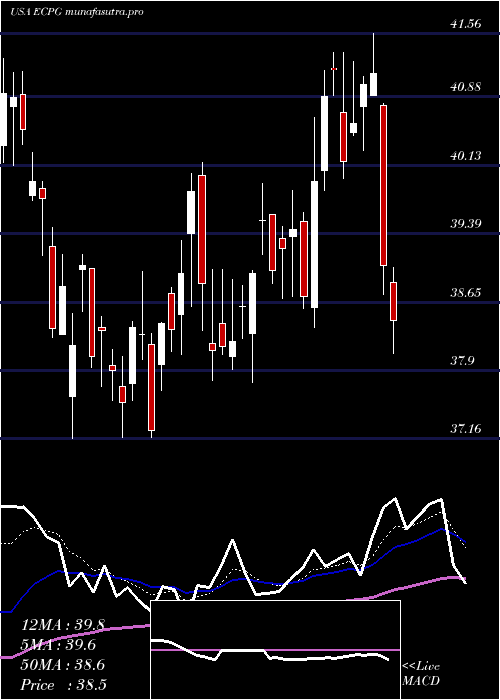
Daily price and charts and targets EncoreCapital Strong Daily Stock price targets for EncoreCapital ECPG are 52.41 and 54.44 | Daily Target 1 | 50.83 | | Daily Target 2 | 51.95 | | Daily Target 3 | 52.863333333333 | | Daily Target 4 | 53.98 | | Daily Target 5 | 54.89 |
Daily price and volume Encore Capital
| Date |
Closing |
Open |
Range |
Volume |
Thu 04 December 2025 |
53.06 (1.53%) |
51.87 |
51.75 - 53.78 |
1.199 times |
Wed 03 December 2025 |
52.26 (-1.1%) |
52.79 |
51.90 - 53.08 |
0.6878 times |
Tue 02 December 2025 |
52.84 (-0.19%) |
53.27 |
52.53 - 53.63 |
1.1364 times |
Mon 01 December 2025 |
52.94 (2.02%) |
51.09 |
51.00 - 52.98 |
1.0173 times |
Fri 28 November 2025 |
51.89 (1.49%) |
51.50 |
51.41 - 52.47 |
0.4697 times |
Wed 26 November 2025 |
51.13 (-0.7%) |
51.46 |
50.24 - 52.00 |
1.3905 times |
Tue 25 November 2025 |
51.49 (4.02%) |
49.56 |
49.56 - 51.84 |
1.3166 times |
Mon 24 November 2025 |
49.50 (0.43%) |
49.15 |
48.90 - 50.03 |
1.1859 times |
Fri 21 November 2025 |
49.29 (3.29%) |
47.75 |
47.75 - 49.94 |
0.8473 times |
Thu 20 November 2025 |
47.72 (0%) |
48.40 |
47.49 - 49.51 |
0.7497 times |
Wed 19 November 2025 |
47.72 (-2.05%) |
48.90 |
47.68 - 49.52 |
0.5228 times |
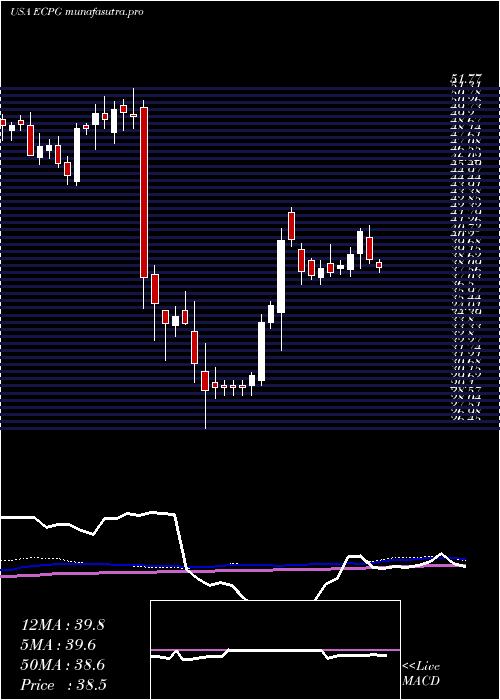
Weekly price and charts EncoreCapital Strong weekly Stock price targets for EncoreCapital ECPG are 52.03 and 54.81 | Weekly Target 1 | 49.83 | | Weekly Target 2 | 51.45 | | Weekly Target 3 | 52.613333333333 | | Weekly Target 4 | 54.23 | | Weekly Target 5 | 55.39 |
Weekly price and volumes for Encore Capital
| Date |
Closing |
Open |
Range |
Volume |
Thu 04 December 2025 |
53.06 (2.25%) |
51.09 |
51.00 - 53.78 |
1.0123 times |
Fri 28 November 2025 |
51.89 (5.27%) |
49.15 |
48.90 - 52.47 |
1.093 times |
Fri 21 November 2025 |
49.29 (-0.6%) |
49.46 |
47.49 - 49.94 |
0.8892 times |
Fri 14 November 2025 |
49.59 (4.82%) |
48.68 |
47.95 - 50.18 |
1.0859 times |
Fri 07 November 2025 |
47.31 (13.78%) |
42.76 |
41.06 - 51.47 |
1.5535 times |
Fri 31 October 2025 |
41.58 (0%) |
40.72 |
40.52 - 41.82 |
0.157 times |
Fri 31 October 2025 |
41.58 (-7.17%) |
44.88 |
40.52 - 45.30 |
0.811 times |
Fri 24 October 2025 |
44.79 (8.29%) |
41.74 |
41.23 - 45.22 |
0.6521 times |
Fri 17 October 2025 |
41.36 (-1.48%) |
42.43 |
39.94 - 45.49 |
1.3327 times |
Fri 10 October 2025 |
41.98 (1.62%) |
41.72 |
40.48 - 43.73 |
1.4133 times |
Fri 03 October 2025 |
41.31 (-5.51%) |
43.91 |
40.29 - 44.09 |
1.5211 times |
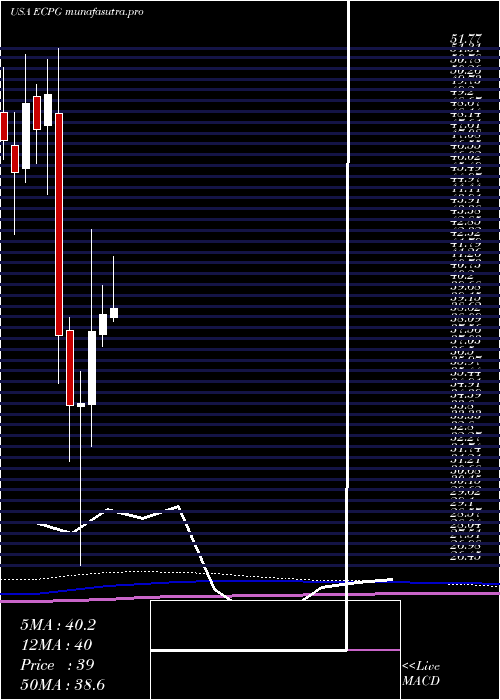
Monthly price and charts EncoreCapital Strong monthly Stock price targets for EncoreCapital ECPG are 52.03 and 54.81 | Monthly Target 1 | 49.83 | | Monthly Target 2 | 51.45 | | Monthly Target 3 | 52.613333333333 | | Monthly Target 4 | 54.23 | | Monthly Target 5 | 55.39 |
Monthly price and volumes Encore Capital
| Date |
Closing |
Open |
Range |
Volume |
Thu 04 December 2025 |
53.06 (2.25%) |
51.09 |
51.00 - 53.78 |
0.195 times |
Fri 28 November 2025 |
51.89 (24.8%) |
42.76 |
41.06 - 52.47 |
0.8904 times |
Fri 31 October 2025 |
41.58 (-0.38%) |
41.44 |
39.94 - 45.49 |
1.0197 times |
Tue 30 September 2025 |
41.74 (-0.24%) |
41.28 |
40.80 - 46.67 |
1.2905 times |
Fri 29 August 2025 |
41.84 (13.45%) |
36.19 |
35.68 - 42.91 |
1.1352 times |
Thu 31 July 2025 |
36.88 (-4.73%) |
38.59 |
36.55 - 41.56 |
0.888 times |
Mon 30 June 2025 |
38.71 (2.14%) |
37.73 |
37.17 - 40.16 |
0.8805 times |
Fri 30 May 2025 |
37.90 (10.17%) |
34.32 |
32.27 - 42.91 |
1.2095 times |
Wed 30 April 2025 |
34.40 (0.35%) |
34.25 |
26.45 - 35.93 |
1.1807 times |
Mon 31 March 2025 |
34.28 (-9.12%) |
37.96 |
31.54 - 38.58 |
1.3105 times |
Fri 28 February 2025 |
37.72 (-23.8%) |
48.55 |
35.38 - 51.77 |
1.0577 times |
DMA SMA EMA moving averages of Encore Capital ECPG
DMA (daily moving average) of Encore Capital ECPG
| DMA period | DMA value | | 5 day DMA | 52.6 | | 12 day DMA | 50.71 | | 20 day DMA | 49.87 | | 35 day DMA | 46.7 | | 50 day DMA | 45.46 | | 100 day DMA | 43.34 | | 150 day DMA | 41.81 | | 200 day DMA | 40.11 | EMA (exponential moving average) of Encore Capital ECPG
| EMA period | EMA current | EMA prev | EMA prev2 | | 5 day EMA | 52.39 | 52.05 | 51.94 | | 12 day EMA | 51.05 | 50.68 | 50.39 | | 20 day EMA | 49.69 | 49.33 | 49.02 | | 35 day EMA | 48 | 47.7 | 47.43 | | 50 day EMA | 46.13 | 45.85 | 45.59 |
SMA (simple moving average) of Encore Capital ECPG
| SMA period | SMA current | SMA prev | SMA prev2 | | 5 day SMA | 52.6 | 52.21 | 52.06 | | 12 day SMA | 50.71 | 50.3 | 50.08 | | 20 day SMA | 49.87 | 49.36 | 48.8 | | 35 day SMA | 46.7 | 46.44 | 46.23 | | 50 day SMA | 45.46 | 45.26 | 45.12 | | 100 day SMA | 43.34 | 43.18 | 43.05 | | 150 day SMA | 41.81 | 41.69 | 41.57 | | 200 day SMA | 40.11 | 40.1 | 40.09 |
|
|
