GraftechInternational EAF full analysis,charts,indicators,moving averages,SMA,DMA,EMA,ADX,MACD,RSIGraftech International EAF WideScreen charts, DMA,SMA,EMA technical analysis, forecast prediction, by indicators ADX,MACD,RSI,CCI USA stock exchange
operates under Energy sector & deals in Industrial Machinery Components
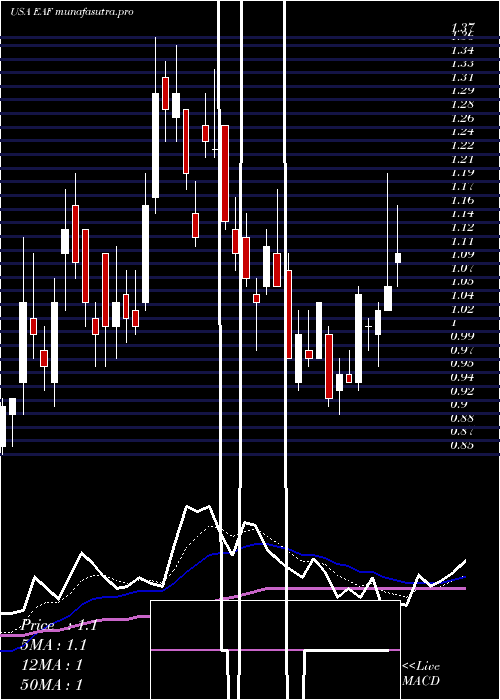
Daily price and charts and targets GraftechInternational Strong Daily Stock price targets for GraftechInternational EAF are 16.55 and 18.09 | Daily Target 1 | 15.32 | | Daily Target 2 | 16.24 | | Daily Target 3 | 16.863333333333 | | Daily Target 4 | 17.78 | | Daily Target 5 | 18.4 |
Daily price and volume Graftech International
| Date |
Closing |
Open |
Range |
Volume |
Thu 04 December 2025 |
17.15 (5.28%) |
16.33 |
15.95 - 17.49 |
1.4803 times |
Wed 03 December 2025 |
16.29 (7.1%) |
15.21 |
15.15 - 16.43 |
1.2604 times |
Tue 02 December 2025 |
15.21 (5.04%) |
14.50 |
14.38 - 15.38 |
1.0144 times |
Mon 01 December 2025 |
14.48 (0.42%) |
14.20 |
13.80 - 14.97 |
0.7706 times |
Fri 28 November 2025 |
14.42 (1.84%) |
14.19 |
13.99 - 14.69 |
0.3058 times |
Wed 26 November 2025 |
14.16 (9.85%) |
12.99 |
12.62 - 14.35 |
0.7452 times |
Tue 25 November 2025 |
12.89 (2.63%) |
12.68 |
12.41 - 13.32 |
0.8742 times |
Mon 24 November 2025 |
12.56 (3.29%) |
12.21 |
12.13 - 12.67 |
1.2404 times |
Fri 21 November 2025 |
12.16 (1.59%) |
11.95 |
11.63 - 12.28 |
1.0011 times |
Thu 20 November 2025 |
11.97 (-6.92%) |
13.40 |
11.96 - 13.90 |
1.3075 times |
Wed 19 November 2025 |
12.86 (-0.31%) |
12.95 |
12.41 - 13.26 |
0.8416 times |
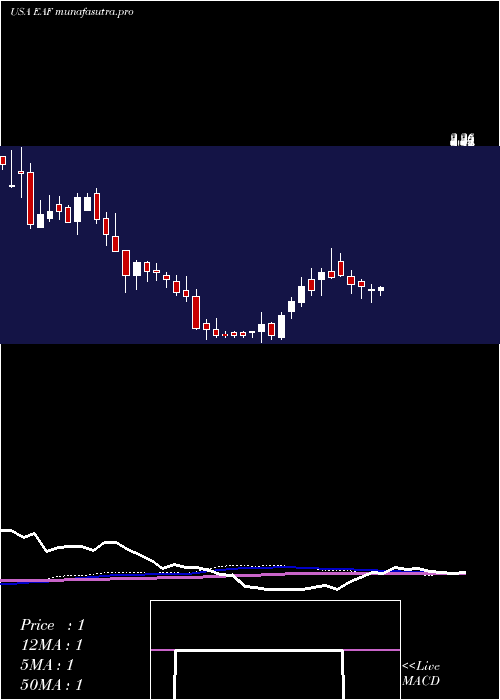
Weekly price and charts GraftechInternational Strong weekly Stock price targets for GraftechInternational EAF are 15.48 and 19.17 | Weekly Target 1 | 12.46 | | Weekly Target 2 | 14.8 | | Weekly Target 3 | 16.146666666667 | | Weekly Target 4 | 18.49 | | Weekly Target 5 | 19.84 |
Weekly price and volumes for Graftech International
| Date |
Closing |
Open |
Range |
Volume |
Thu 04 December 2025 |
17.15 (18.93%) |
14.20 |
13.80 - 17.49 |
0.8246 times |
Fri 28 November 2025 |
14.42 (18.59%) |
12.21 |
12.13 - 14.69 |
0.5768 times |
Fri 21 November 2025 |
12.16 (-10.52%) |
13.46 |
11.63 - 13.99 |
1.0029 times |
Fri 14 November 2025 |
13.59 (5.43%) |
13.36 |
12.87 - 14.65 |
0.9162 times |
Fri 07 November 2025 |
12.89 (-4.52%) |
12.75 |
11.47 - 13.49 |
0.6821 times |
Fri 31 October 2025 |
13.50 (0%) |
12.81 |
12.56 - 13.57 |
0.225 times |
Fri 31 October 2025 |
13.50 (-20.68%) |
16.77 |
12.56 - 16.77 |
1.4964 times |
Fri 24 October 2025 |
17.02 (-3.84%) |
18.06 |
15.84 - 19.00 |
1.0022 times |
Fri 17 October 2025 |
17.70 (-2.96%) |
18.72 |
16.58 - 20.32 |
1.4352 times |
Fri 10 October 2025 |
18.24 (40.31%) |
13.40 |
12.84 - 19.77 |
1.8385 times |
Fri 03 October 2025 |
13.00 (-6%) |
14.10 |
12.13 - 14.15 |
0.8826 times |
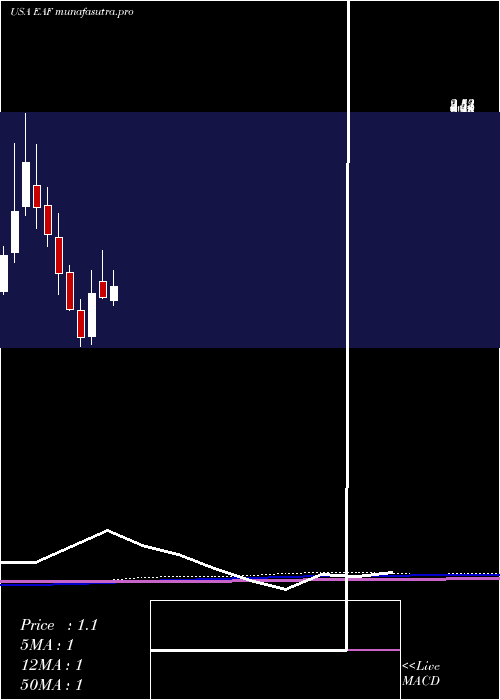
Monthly price and charts GraftechInternational Strong monthly Stock price targets for GraftechInternational EAF are 15.48 and 19.17 | Monthly Target 1 | 12.46 | | Monthly Target 2 | 14.8 | | Monthly Target 3 | 16.146666666667 | | Monthly Target 4 | 18.49 | | Monthly Target 5 | 19.84 |
Monthly price and volumes Graftech International
| Date |
Closing |
Open |
Range |
Volume |
Thu 04 December 2025 |
17.15 (18.93%) |
14.20 |
13.80 - 17.49 |
0.0227 times |
Fri 28 November 2025 |
14.42 (6.81%) |
12.75 |
11.47 - 14.69 |
0.0874 times |
Fri 31 October 2025 |
13.50 (5.3%) |
12.80 |
12.13 - 20.32 |
0.1771 times |
Tue 30 September 2025 |
12.82 (29.76%) |
9.47 |
7.65 - 14.20 |
0.2023 times |
Fri 29 August 2025 |
9.88 (610.79%) |
1.45 |
0.93 - 10.00 |
1.013 times |
Thu 31 July 2025 |
1.39 (43.3%) |
0.94 |
0.90 - 1.75 |
1.6796 times |
Mon 30 June 2025 |
0.97 (-3%) |
1.10 |
0.96 - 1.37 |
2.4142 times |
Fri 30 May 2025 |
1.00 (58.73%) |
0.64 |
0.57 - 1.20 |
1.6456 times |
Wed 30 April 2025 |
0.63 (-27.59%) |
0.86 |
0.55 - 0.95 |
1.5174 times |
Mon 31 March 2025 |
0.87 (-25.64%) |
1.18 |
0.86 - 1.24 |
1.2408 times |
Fri 28 February 2025 |
1.17 (-22%) |
1.48 |
0.99 - 1.68 |
2.343 times |
DMA SMA EMA moving averages of Graftech International EAF
DMA (daily moving average) of Graftech International EAF
| DMA period | DMA value | | 5 day DMA | 15.51 | | 12 day DMA | 13.92 | | 20 day DMA | 13.65 | | 35 day DMA | 14.27 | | 50 day DMA | 14.71 | | 100 day DMA | 9.76 | | 150 day DMA | 6.83 | | 200 day DMA | 5.35 | EMA (exponential moving average) of Graftech International EAF
| EMA period | EMA current | EMA prev | EMA prev2 | | 5 day EMA | 15.7 | 14.98 | 14.32 | | 12 day EMA | 14.6 | 14.14 | 13.75 | | 20 day EMA | 14.24 | 13.93 | 13.68 | | 35 day EMA | 14.33 | 14.16 | 14.03 | | 50 day EMA | 14.67 | 14.57 | 14.5 |
SMA (simple moving average) of Graftech International EAF
| SMA period | SMA current | SMA prev | SMA prev2 | | 5 day SMA | 15.51 | 14.91 | 14.23 | | 12 day SMA | 13.92 | 13.55 | 13.33 | | 20 day SMA | 13.65 | 13.4 | 13.19 | | 35 day SMA | 14.27 | 14.31 | 14.41 | | 50 day SMA | 14.71 | 14.63 | 14.57 | | 100 day SMA | 9.76 | 9.6 | 9.44 | | 150 day SMA | 6.83 | 6.72 | 6.62 | | 200 day SMA | 5.35 | 5.27 | 5.19 |
|
|
