ElectronicArts EA full analysis,charts,indicators,moving averages,SMA,DMA,EMA,ADX,MACD,RSIElectronic Arts EA WideScreen charts, DMA,SMA,EMA technical analysis, forecast prediction, by indicators ADX,MACD,RSI,CCI USA stock exchange
operates under Technology sector & deals in Computer Software Prepackaged Software
Daily price and charts and targets ElectronicArts Strong Daily Stock price targets for ElectronicArts EA are 203.26 and 203.77 | Daily Target 1 | 202.85 | | Daily Target 2 | 203.15 | | Daily Target 3 | 203.36333333333 | | Daily Target 4 | 203.66 | | Daily Target 5 | 203.87 |
Daily price and volume Electronic Arts
| Date |
Closing |
Open |
Range |
Volume |
Thu 04 December 2025 |
203.44 (0.11%) |
203.07 |
203.07 - 203.58 |
0.7524 times |
Wed 03 December 2025 |
203.21 (-0.01%) |
202.93 |
202.80 - 203.40 |
0.7022 times |
Tue 02 December 2025 |
203.24 (0.31%) |
202.81 |
202.54 - 203.40 |
1.0593 times |
Mon 01 December 2025 |
202.62 (0.29%) |
201.99 |
201.70 - 202.86 |
1.6528 times |
Fri 28 November 2025 |
202.03 (0.05%) |
201.87 |
201.75 - 202.21 |
0.4151 times |
Wed 26 November 2025 |
201.92 (0.13%) |
201.88 |
201.72 - 202.04 |
0.7533 times |
Tue 25 November 2025 |
201.66 (0.3%) |
201.30 |
201.24 - 201.96 |
0.5714 times |
Mon 24 November 2025 |
201.05 (0.18%) |
201.00 |
200.98 - 201.91 |
1.4418 times |
Fri 21 November 2025 |
200.69 (-0.21%) |
201.30 |
200.57 - 201.50 |
1.8076 times |
Thu 20 November 2025 |
201.12 (-0.23%) |
201.65 |
201.05 - 202.24 |
0.8442 times |
Wed 19 November 2025 |
201.58 (-0.11%) |
201.33 |
201.33 - 202.17 |
0.9373 times |
Weekly price and charts ElectronicArts Strong weekly Stock price targets for ElectronicArts EA are 202.57 and 204.45 | Weekly Target 1 | 201.03 | | Weekly Target 2 | 202.23 | | Weekly Target 3 | 202.90666666667 | | Weekly Target 4 | 204.11 | | Weekly Target 5 | 204.79 |
Weekly price and volumes for Electronic Arts
| Date |
Closing |
Open |
Range |
Volume |
Thu 04 December 2025 |
203.44 (0.7%) |
201.99 |
201.70 - 203.58 |
0.8287 times |
Fri 28 November 2025 |
202.03 (0.67%) |
201.00 |
200.98 - 202.21 |
0.6328 times |
Fri 21 November 2025 |
200.69 (-0.18%) |
201.42 |
200.57 - 202.24 |
1.2054 times |
Fri 14 November 2025 |
201.06 (0.23%) |
200.60 |
200.56 - 202.22 |
0.7812 times |
Fri 07 November 2025 |
200.60 (0.27%) |
200.16 |
199.81 - 200.99 |
0.6245 times |
Fri 31 October 2025 |
200.06 (0%) |
200.04 |
200.00 - 200.45 |
0.2087 times |
Fri 31 October 2025 |
200.06 (-0.39%) |
200.63 |
199.74 - 200.90 |
1.0621 times |
Fri 24 October 2025 |
200.84 (0.27%) |
200.49 |
200.14 - 200.90 |
1.3548 times |
Fri 17 October 2025 |
200.30 (0.14%) |
200.05 |
200.04 - 201.15 |
1.4649 times |
Fri 10 October 2025 |
200.02 (-0.33%) |
200.67 |
199.80 - 200.85 |
1.8369 times |
Fri 03 October 2025 |
200.69 (3.8%) |
203.49 |
200.55 - 203.75 |
3.9761 times |

Monthly price and charts ElectronicArts Strong monthly Stock price targets for ElectronicArts EA are 202.57 and 204.45 | Monthly Target 1 | 201.03 | | Monthly Target 2 | 202.23 | | Monthly Target 3 | 202.90666666667 | | Monthly Target 4 | 204.11 | | Monthly Target 5 | 204.79 |
Monthly price and volumes Electronic Arts
| Date |
Closing |
Open |
Range |
Volume |
Thu 04 December 2025 |
203.44 (0.7%) |
201.99 |
201.70 - 203.58 |
0.1496 times |
Fri 28 November 2025 |
202.03 (0.98%) |
200.16 |
199.81 - 202.24 |
0.5856 times |
Fri 31 October 2025 |
200.06 (-0.81%) |
201.52 |
199.74 - 202.31 |
1.2622 times |
Tue 30 September 2025 |
201.70 (17.3%) |
170.00 |
164.50 - 203.75 |
1.5923 times |
Fri 29 August 2025 |
171.95 (12.76%) |
152.76 |
151.50 - 180.90 |
1.0496 times |
Thu 31 July 2025 |
152.49 (-4.51%) |
159.53 |
146.97 - 160.99 |
0.9613 times |
Mon 30 June 2025 |
159.70 (11.07%) |
143.61 |
143.51 - 159.91 |
0.9085 times |
Fri 30 May 2025 |
143.78 (-0.9%) |
145.18 |
141.19 - 160.70 |
1.2869 times |
Wed 30 April 2025 |
145.09 (0.39%) |
145.00 |
131.15 - 147.44 |
1.0106 times |
Mon 31 March 2025 |
144.52 (11.93%) |
130.38 |
128.87 - 145.87 |
1.1934 times |
Fri 28 February 2025 |
129.12 (5.05%) |
121.76 |
120.22 - 134.65 |
1.4945 times |

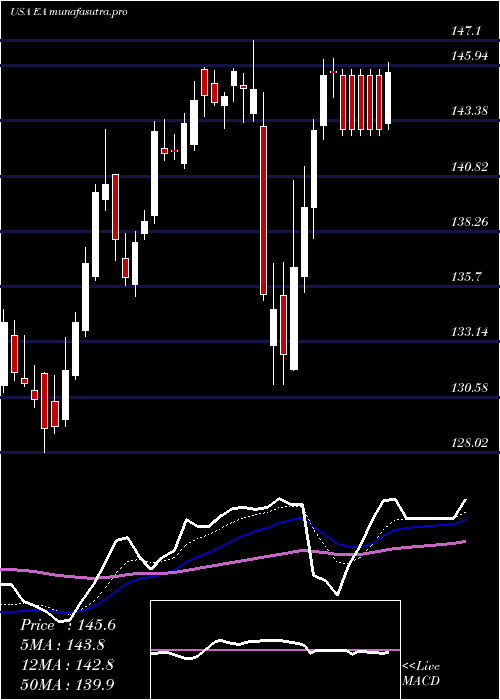
DMA SMA EMA moving averages of Electronic Arts EA
DMA (daily moving average) of Electronic Arts EA
| DMA period | DMA value | | 5 day DMA | 202.91 | | 12 day DMA | 202.03 | | 20 day DMA | 201.69 | | 35 day DMA | 201.15 | | 50 day DMA | 200.22 | | 100 day DMA | 183.22 | | 150 day DMA | 172.46 | | 200 day DMA | 164.27 | EMA (exponential moving average) of Electronic Arts EA
| EMA period | EMA current | EMA prev | EMA prev2 | | 5 day EMA | 202.93 | 202.68 | 202.41 | | 12 day EMA | 202.26 | 202.05 | 201.84 | | 20 day EMA | 201.59 | 201.4 | 201.21 | | 35 day EMA | 199.82 | 199.61 | 199.4 | | 50 day EMA | 198.19 | 197.98 | 197.77 |
SMA (simple moving average) of Electronic Arts EA
| SMA period | SMA current | SMA prev | SMA prev2 | | 5 day SMA | 202.91 | 202.6 | 202.29 | | 12 day SMA | 202.03 | 201.81 | 201.63 | | 20 day SMA | 201.69 | 201.56 | 201.44 | | 35 day SMA | 201.15 | 201.08 | 200.99 | | 50 day SMA | 200.22 | 199.5 | 198.91 | | 100 day SMA | 183.22 | 182.68 | 182.13 | | 150 day SMA | 172.46 | 172.07 | 171.69 | | 200 day SMA | 164.27 | 163.89 | 163.52 |
|
|
