DycomIndustries DY full analysis,charts,indicators,moving averages,SMA,DMA,EMA,ADX,MACD,RSIDycom Industries DY WideScreen charts, DMA,SMA,EMA technical analysis, forecast prediction, by indicators ADX,MACD,RSI,CCI USA stock exchange
operates under Basic Industries sector & deals in Water Supply
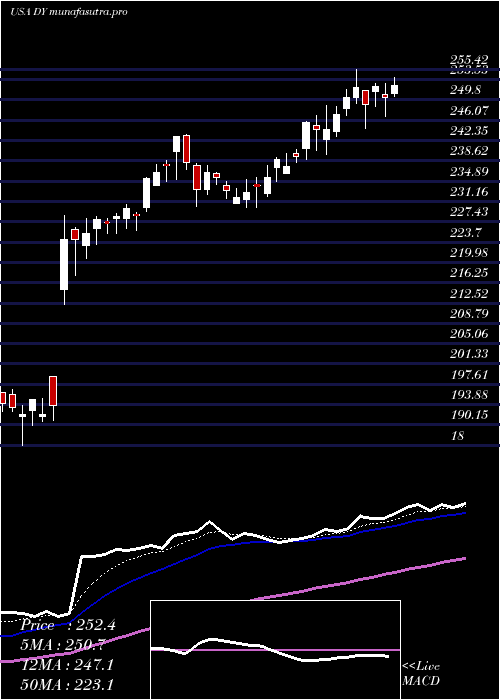
Daily price and charts and targets DycomIndustries Strong Daily Stock price targets for DycomIndustries DY are 350.64 and 362 | Daily Target 1 | 341.81 | | Daily Target 2 | 348.11 | | Daily Target 3 | 353.17333333333 | | Daily Target 4 | 359.47 | | Daily Target 5 | 364.53 |
Daily price and volume Dycom Industries
| Date |
Closing |
Open |
Range |
Volume |
Thu 04 December 2025 |
354.40 (0.45%) |
349.66 |
346.88 - 358.24 |
0.7135 times |
Wed 03 December 2025 |
352.80 (-0.43%) |
353.08 |
342.46 - 354.87 |
0.7089 times |
Tue 02 December 2025 |
354.31 (1.21%) |
354.22 |
351.24 - 357.69 |
0.9655 times |
Mon 01 December 2025 |
350.06 (-3.17%) |
356.87 |
347.66 - 358.01 |
1.0444 times |
Fri 28 November 2025 |
361.53 (1.85%) |
357.11 |
355.56 - 364.40 |
0.3965 times |
Wed 26 November 2025 |
354.96 (1.87%) |
350.00 |
350.00 - 362.54 |
1.1815 times |
Tue 25 November 2025 |
348.44 (2.27%) |
342.21 |
340.79 - 349.51 |
0.9239 times |
Mon 24 November 2025 |
340.69 (4.35%) |
331.44 |
329.82 - 343.69 |
1.0373 times |
Fri 21 November 2025 |
326.49 (0.96%) |
325.80 |
320.02 - 335.42 |
1.317 times |
Thu 20 November 2025 |
323.37 (-0.59%) |
334.41 |
322.58 - 350.87 |
1.7116 times |
Wed 19 November 2025 |
325.29 (9.82%) |
324.48 |
317.09 - 350.00 |
2.5289 times |
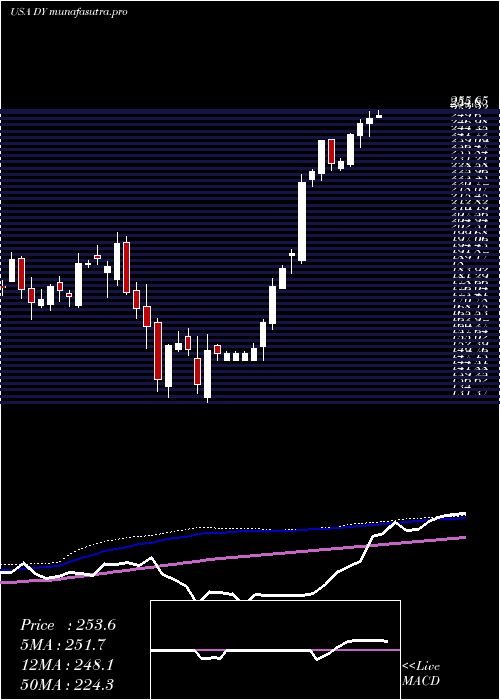
Weekly price and charts DycomIndustries Strong weekly Stock price targets for DycomIndustries DY are 340.54 and 356.32 | Weekly Target 1 | 335.92 | | Weekly Target 2 | 345.16 | | Weekly Target 3 | 351.7 | | Weekly Target 4 | 360.94 | | Weekly Target 5 | 367.48 |
Weekly price and volumes for Dycom Industries
| Date |
Closing |
Open |
Range |
Volume |
Thu 04 December 2025 |
354.40 (-1.97%) |
356.87 |
342.46 - 358.24 |
0.9814 times |
Fri 28 November 2025 |
361.53 (10.73%) |
331.44 |
329.82 - 364.40 |
1.0119 times |
Fri 21 November 2025 |
326.49 (12.12%) |
291.20 |
289.21 - 350.87 |
2.1951 times |
Fri 14 November 2025 |
291.20 (1.67%) |
292.07 |
273.03 - 298.07 |
0.913 times |
Fri 07 November 2025 |
286.41 (-0.48%) |
281.42 |
273.00 - 291.77 |
0.9193 times |
Fri 31 October 2025 |
287.79 (0%) |
284.76 |
284.76 - 293.46 |
0.1764 times |
Fri 31 October 2025 |
287.79 (-1.43%) |
294.68 |
277.40 - 294.68 |
1.2413 times |
Fri 24 October 2025 |
291.96 (-0.18%) |
299.68 |
272.31 - 300.17 |
0.7428 times |
Fri 17 October 2025 |
292.49 (2.87%) |
291.54 |
285.58 - 301.88 |
0.8271 times |
Fri 10 October 2025 |
284.33 (-0.74%) |
289.28 |
281.71 - 294.82 |
0.9917 times |
Fri 03 October 2025 |
286.45 (-0.35%) |
291.00 |
285.59 - 300.00 |
1.1769 times |
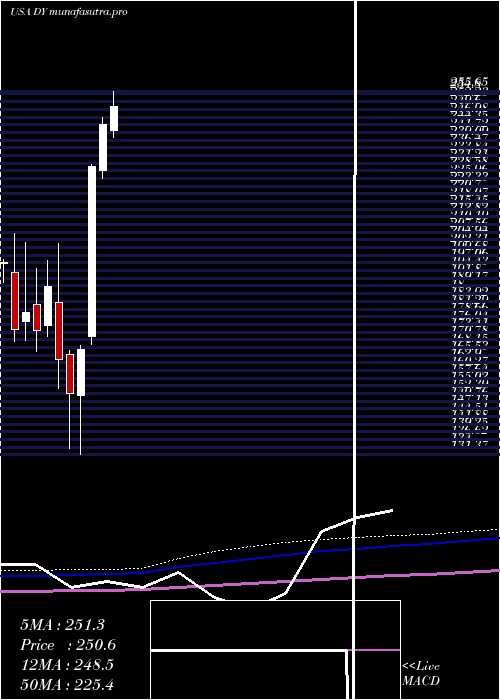
Monthly price and charts DycomIndustries Strong monthly Stock price targets for DycomIndustries DY are 340.54 and 356.32 | Monthly Target 1 | 335.92 | | Monthly Target 2 | 345.16 | | Monthly Target 3 | 351.7 | | Monthly Target 4 | 360.94 | | Monthly Target 5 | 367.48 |
Monthly price and volumes Dycom Industries
| Date |
Closing |
Open |
Range |
Volume |
Thu 04 December 2025 |
354.40 (-1.97%) |
356.87 |
342.46 - 358.24 |
0.1943 times |
Fri 28 November 2025 |
361.53 (25.62%) |
281.42 |
273.00 - 364.40 |
0.9978 times |
Fri 31 October 2025 |
287.79 (-1.36%) |
289.64 |
272.31 - 301.88 |
0.9079 times |
Tue 30 September 2025 |
291.76 (15.56%) |
248.88 |
242.55 - 300.00 |
1.1008 times |
Fri 29 August 2025 |
252.47 (-6.08%) |
263.55 |
233.00 - 285.64 |
1.2413 times |
Thu 31 July 2025 |
268.81 (9.99%) |
242.50 |
239.84 - 271.80 |
0.7492 times |
Mon 30 June 2025 |
244.39 (6.29%) |
228.83 |
225.79 - 246.94 |
0.879 times |
Fri 30 May 2025 |
229.92 (37.22%) |
172.01 |
169.18 - 230.57 |
1.2392 times |
Wed 30 April 2025 |
167.55 (9.98%) |
151.63 |
131.37 - 168.72 |
1.1216 times |
Mon 31 March 2025 |
152.34 (-7.03%) |
165.60 |
133.45 - 167.07 |
1.5688 times |
Fri 28 February 2025 |
163.86 (-13.37%) |
183.63 |
154.22 - 203.63 |
1.3577 times |
DMA SMA EMA moving averages of Dycom Industries DY
DMA (daily moving average) of Dycom Industries DY
| DMA period | DMA value | | 5 day DMA | 354.62 | | 12 day DMA | 340.71 | | 20 day DMA | 320.27 | | 35 day DMA | 306.57 | | 50 day DMA | 301.47 | | 100 day DMA | 282.05 | | 150 day DMA | 262.82 | | 200 day DMA | 235.97 | EMA (exponential moving average) of Dycom Industries DY
| EMA period | EMA current | EMA prev | EMA prev2 | | 5 day EMA | 352.14 | 351.01 | 350.12 | | 12 day EMA | 340.18 | 337.6 | 334.84 | | 20 day EMA | 328.48 | 325.75 | 322.9 | | 35 day EMA | 315.68 | 313.4 | 311.08 | | 50 day EMA | 304.66 | 302.63 | 300.58 |
SMA (simple moving average) of Dycom Industries DY
| SMA period | SMA current | SMA prev | SMA prev2 | | 5 day SMA | 354.62 | 354.73 | 353.86 | | 12 day SMA | 340.71 | 335.66 | 330.53 | | 20 day SMA | 320.27 | 317.05 | 313.52 | | 35 day SMA | 306.57 | 304.99 | 303.27 | | 50 day SMA | 301.47 | 299.91 | 298.51 | | 100 day SMA | 282.05 | 281.01 | 280.02 | | 150 day SMA | 262.82 | 261.58 | 260.34 | | 200 day SMA | 235.97 | 235.09 | 234.2 |
|
|
