AdvisorsharesDorsey DWSH full analysis,charts,indicators,moving averages,SMA,DMA,EMA,ADX,MACD,RSIAdvisorshares Dorsey DWSH WideScreen charts, DMA,SMA,EMA technical analysis, forecast prediction, by indicators ADX,MACD,RSI,CCI USA stock exchange
operates under N A sector & deals in N A
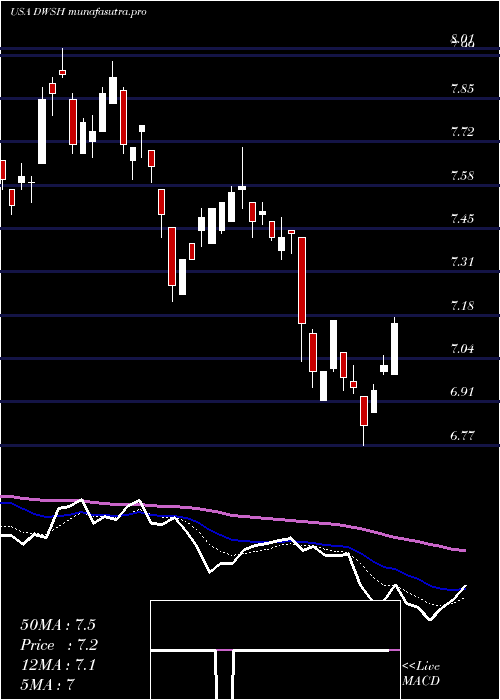
Daily price and charts and targets AdvisorsharesDorsey Strong Daily Stock price targets for AdvisorsharesDorsey DWSH are 6.86 and 6.92 | Daily Target 1 | 6.81 | | Daily Target 2 | 6.84 | | Daily Target 3 | 6.8666666666667 | | Daily Target 4 | 6.9 | | Daily Target 5 | 6.93 |
Daily price and volume Advisorshares Dorsey
| Date |
Closing |
Open |
Range |
Volume |
Thu 04 December 2025 |
6.88 (0.58%) |
6.83 |
6.83 - 6.89 |
0.2414 times |
Wed 03 December 2025 |
6.84 (-1.16%) |
6.91 |
6.82 - 6.91 |
1.1963 times |
Tue 02 December 2025 |
6.92 (0.14%) |
6.97 |
6.92 - 6.97 |
0.2943 times |
Mon 01 December 2025 |
6.91 (-0.29%) |
6.95 |
6.84 - 6.96 |
1.0036 times |
Fri 28 November 2025 |
6.93 (-0.43%) |
6.97 |
6.90 - 6.97 |
0.3748 times |
Wed 26 November 2025 |
6.96 (-0.85%) |
7.02 |
6.94 - 7.03 |
0.8406 times |
Tue 25 November 2025 |
7.02 (-2.5%) |
7.12 |
6.99 - 7.12 |
1.9521 times |
Mon 24 November 2025 |
7.20 (-0.41%) |
7.22 |
7.18 - 7.25 |
1.7002 times |
Fri 21 November 2025 |
7.23 (-3.21%) |
7.47 |
7.17 - 7.47 |
0.7707 times |
Thu 20 November 2025 |
7.47 (0.95%) |
7.39 |
7.34 - 7.50 |
1.6261 times |
Wed 19 November 2025 |
7.40 (0.95%) |
7.36 |
7.36 - 7.42 |
0.5124 times |
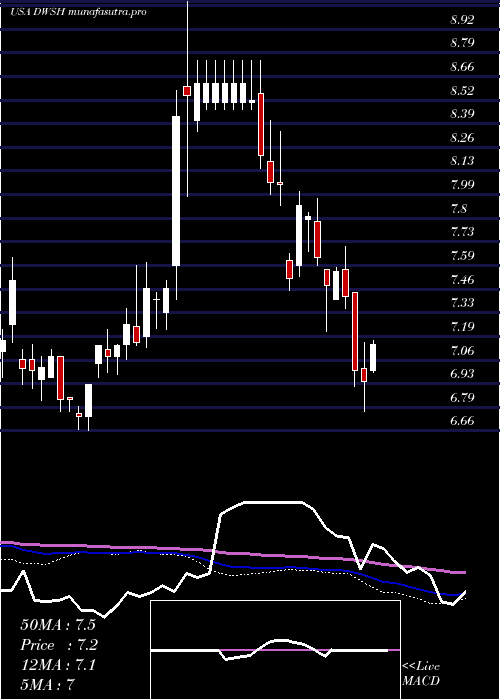
Weekly price and charts AdvisorsharesDorsey Strong weekly Stock price targets for AdvisorsharesDorsey DWSH are 6.78 and 6.93 | Weekly Target 1 | 6.74 | | Weekly Target 2 | 6.81 | | Weekly Target 3 | 6.89 | | Weekly Target 4 | 6.96 | | Weekly Target 5 | 7.04 |
Weekly price and volumes for Advisorshares Dorsey
| Date |
Closing |
Open |
Range |
Volume |
Thu 04 December 2025 |
6.88 (-0.72%) |
6.95 |
6.82 - 6.97 |
0.6166 times |
Fri 28 November 2025 |
6.93 (-4.15%) |
7.22 |
6.90 - 7.25 |
1.0971 times |
Fri 21 November 2025 |
7.23 (0.7%) |
7.23 |
7.17 - 7.50 |
1.288 times |
Fri 14 November 2025 |
7.18 (0.28%) |
7.14 |
7.04 - 7.24 |
1.1611 times |
Fri 07 November 2025 |
7.16 (1.85%) |
7.17 |
7.09 - 7.25 |
0.9258 times |
Fri 31 October 2025 |
7.03 (0%) |
7.08 |
7.03 - 7.10 |
0.0869 times |
Fri 31 October 2025 |
7.03 (4.3%) |
6.72 |
6.71 - 7.10 |
1.5113 times |
Fri 24 October 2025 |
6.74 (-2.18%) |
6.89 |
6.70 - 6.89 |
1.1348 times |
Fri 17 October 2025 |
6.89 (-2.41%) |
7.02 |
6.81 - 7.02 |
1.0227 times |
Fri 10 October 2025 |
7.06 (5.85%) |
6.64 |
6.64 - 7.08 |
1.1558 times |
Fri 03 October 2025 |
6.67 (-3.19%) |
6.87 |
6.61 - 6.96 |
0.6955 times |
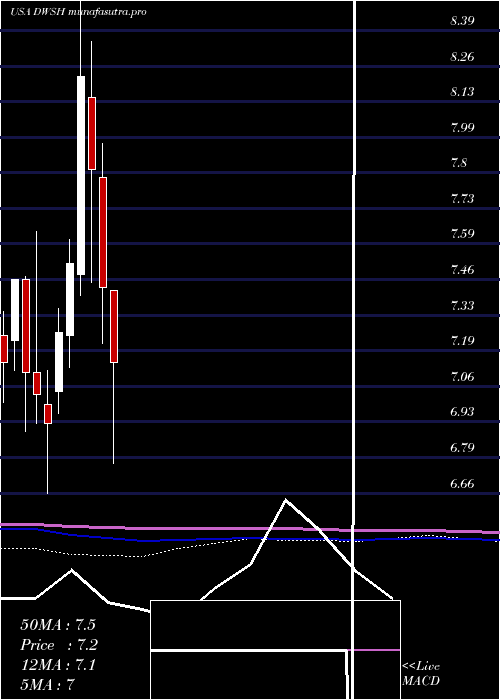
Monthly price and charts AdvisorsharesDorsey Strong monthly Stock price targets for AdvisorsharesDorsey DWSH are 6.78 and 6.93 | Monthly Target 1 | 6.74 | | Monthly Target 2 | 6.81 | | Monthly Target 3 | 6.89 | | Monthly Target 4 | 6.96 | | Monthly Target 5 | 7.04 |
Monthly price and volumes Advisorshares Dorsey
| Date |
Closing |
Open |
Range |
Volume |
Thu 04 December 2025 |
6.88 (-0.72%) |
6.95 |
6.82 - 6.97 |
0.1431 times |
Fri 28 November 2025 |
6.93 (-1.42%) |
7.17 |
6.90 - 7.50 |
1.0377 times |
Fri 31 October 2025 |
7.03 (2.33%) |
6.84 |
6.61 - 7.10 |
1.2382 times |
Tue 30 September 2025 |
6.87 (2.84%) |
6.72 |
6.55 - 6.96 |
1.1541 times |
Fri 29 August 2025 |
6.68 (-6.44%) |
7.16 |
6.61 - 7.31 |
1.0038 times |
Thu 31 July 2025 |
7.14 (-3.9%) |
7.42 |
6.67 - 7.42 |
0.5695 times |
Mon 30 June 2025 |
7.43 (-5.59%) |
7.84 |
7.22 - 7.97 |
0.4738 times |
Fri 30 May 2025 |
7.87 (-4.26%) |
8.14 |
7.45 - 8.35 |
0.7952 times |
Wed 30 April 2025 |
8.22 (9.31%) |
7.48 |
7.40 - 9.08 |
2.4933 times |
Mon 31 March 2025 |
7.52 (3.58%) |
7.25 |
7.13 - 7.61 |
1.0915 times |
Fri 28 February 2025 |
7.26 (4.91%) |
7.04 |
6.96 - 7.35 |
0.8528 times |
DMA SMA EMA moving averages of Advisorshares Dorsey DWSH
DMA (daily moving average) of Advisorshares Dorsey DWSH
| DMA period | DMA value | | 5 day DMA | 6.9 | | 12 day DMA | 7.09 | | 20 day DMA | 7.12 | | 35 day DMA | 7.03 | | 50 day DMA | 6.98 | | 100 day DMA | 6.92 | | 150 day DMA | 7.13 | | 200 day DMA | 7.32 | EMA (exponential moving average) of Advisorshares Dorsey DWSH
| EMA period | EMA current | EMA prev | EMA prev2 | | 5 day EMA | 6.91 | 6.93 | 6.97 | | 12 day EMA | 7.01 | 7.03 | 7.06 | | 20 day EMA | 7.03 | 7.05 | 7.07 | | 35 day EMA | 7.01 | 7.02 | 7.03 | | 50 day EMA | 6.96 | 6.96 | 6.96 |
SMA (simple moving average) of Advisorshares Dorsey DWSH
| SMA period | SMA current | SMA prev | SMA prev2 | | 5 day SMA | 6.9 | 6.91 | 6.95 | | 12 day SMA | 7.09 | 7.13 | 7.16 | | 20 day SMA | 7.12 | 7.14 | 7.15 | | 35 day SMA | 7.03 | 7.03 | 7.03 | | 50 day SMA | 6.98 | 6.97 | 6.97 | | 100 day SMA | 6.92 | 6.92 | 6.92 | | 150 day SMA | 7.13 | 7.14 | 7.15 | | 200 day SMA | 7.32 | 7.32 | 7.32 |
|
|
