DukeEnergy DUKH full analysis,charts,indicators,moving averages,SMA,DMA,EMA,ADX,MACD,RSIDuke Energy DUKH WideScreen charts, DMA,SMA,EMA technical analysis, forecast prediction, by indicators ADX,MACD,RSI,CCI USA stock exchange
operates under Public Utilities sector & deals in Power Generation
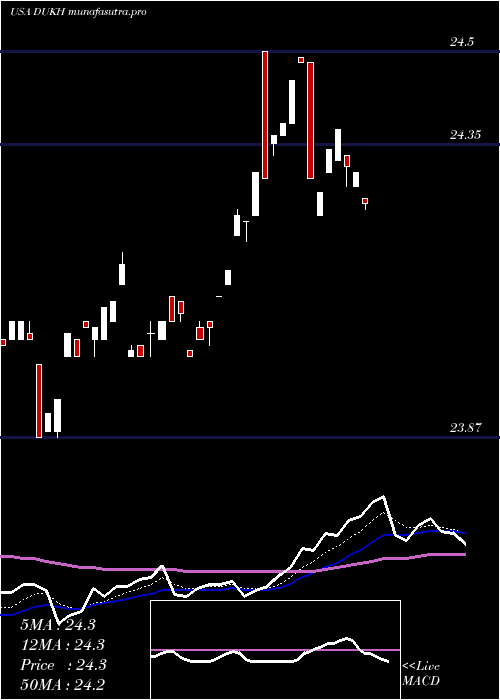
Daily price and charts and targets DukeEnergy Strong Daily Stock price targets for DukeEnergy DUKH are 24.51 and 24.55 | Daily Target 1 | 24.48 | | Daily Target 2 | 24.5 | | Daily Target 3 | 24.516666666667 | | Daily Target 4 | 24.54 | | Daily Target 5 | 24.56 |
Daily price and volume Duke Energy
| Date |
Closing |
Open |
Range |
Volume |
Mon 20 October 2025 |
24.53 (0.29%) |
24.49 |
24.49 - 24.53 |
1.6766 times |
Fri 17 October 2025 |
24.46 (0.16%) |
24.45 |
24.45 - 24.46 |
0.2994 times |
Thu 16 October 2025 |
24.42 (-0.16%) |
24.46 |
24.42 - 24.51 |
0.1796 times |
Wed 15 October 2025 |
24.46 (0.33%) |
24.44 |
24.43 - 24.46 |
0.479 times |
Tue 14 October 2025 |
24.38 (-0.04%) |
24.32 |
24.32 - 24.38 |
0.2994 times |
Mon 13 October 2025 |
24.39 (0.41%) |
24.34 |
24.30 - 24.39 |
1.6766 times |
Fri 10 October 2025 |
24.29 (-0.37%) |
24.40 |
24.29 - 24.40 |
0.5389 times |
Thu 09 October 2025 |
24.38 (-0.33%) |
24.40 |
24.38 - 24.43 |
1.0778 times |
Wed 08 October 2025 |
24.46 (-0.12%) |
24.48 |
24.46 - 24.50 |
2.0359 times |
Tue 07 October 2025 |
24.49 (-0.61%) |
24.52 |
24.49 - 24.52 |
1.7365 times |
Mon 06 October 2025 |
24.64 (-0.08%) |
24.65 |
24.60 - 24.66 |
2.0958 times |
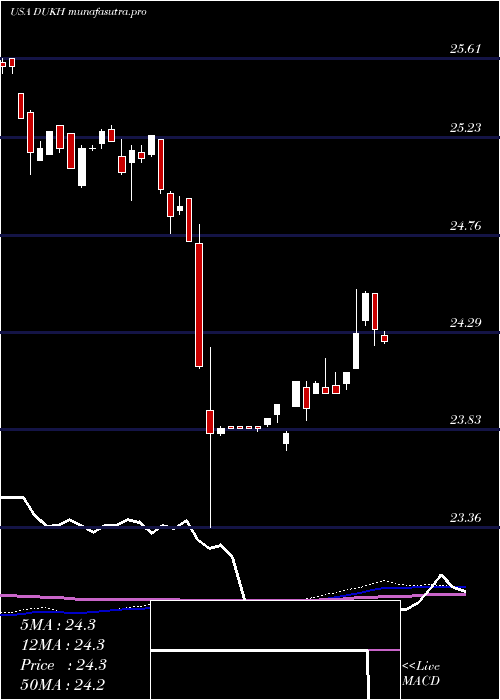
Weekly price and charts DukeEnergy Strong weekly Stock price targets for DukeEnergy DUKH are 24.51 and 24.55 | Weekly Target 1 | 24.48 | | Weekly Target 2 | 24.5 | | Weekly Target 3 | 24.516666666667 | | Weekly Target 4 | 24.54 | | Weekly Target 5 | 24.56 |
Weekly price and volumes for Duke Energy
| Date |
Closing |
Open |
Range |
Volume |
Mon 20 October 2025 |
24.53 (0.29%) |
24.49 |
24.49 - 24.53 |
0.2515 times |
Fri 17 October 2025 |
24.46 (0.7%) |
24.34 |
24.30 - 24.51 |
0.4401 times |
Fri 10 October 2025 |
24.29 (-1.5%) |
24.65 |
24.29 - 24.66 |
1.1226 times |
Fri 03 October 2025 |
24.66 (0.2%) |
24.62 |
24.58 - 24.75 |
4.414 times |
Fri 26 September 2025 |
24.61 (-0.32%) |
24.69 |
24.58 - 24.71 |
1.5716 times |
Fri 19 September 2025 |
24.69 (0.2%) |
24.69 |
24.60 - 24.72 |
0.6736 times |
Fri 12 September 2025 |
24.64 (0.49%) |
24.54 |
24.52 - 24.65 |
0.6825 times |
Fri 05 September 2025 |
24.52 (0.08%) |
24.47 |
24.43 - 24.57 |
0.3772 times |
Fri 29 August 2025 |
24.50 (0%) |
24.53 |
24.50 - 24.53 |
0.0269 times |
Fri 29 August 2025 |
24.50 (-0.12%) |
24.51 |
24.47 - 24.53 |
0.4401 times |
Fri 22 August 2025 |
24.53 (0.49%) |
24.41 |
24.34 - 24.53 |
0.5478 times |
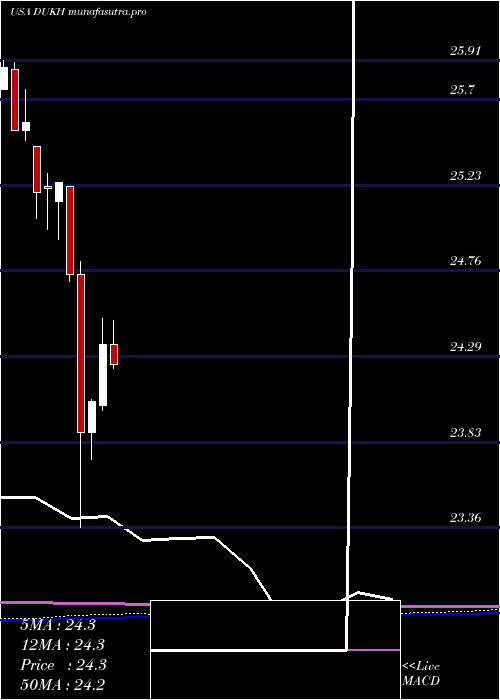
Monthly price and charts DukeEnergy Strong monthly Stock price targets for DukeEnergy DUKH are 24.18 and 24.64 | Monthly Target 1 | 24.06 | | Monthly Target 2 | 24.3 | | Monthly Target 3 | 24.523333333333 | | Monthly Target 4 | 24.76 | | Monthly Target 5 | 24.98 |
Monthly price and volumes Duke Energy
| Date |
Closing |
Open |
Range |
Volume |
Mon 20 October 2025 |
24.53 (-0.33%) |
24.64 |
24.29 - 24.75 |
0.961 times |
Tue 30 September 2025 |
24.61 (0.45%) |
24.47 |
24.43 - 24.72 |
0.6096 times |
Fri 29 August 2025 |
24.50 (0.62%) |
24.34 |
24.26 - 24.53 |
0.2767 times |
Thu 31 July 2025 |
24.35 (-0.04%) |
24.36 |
24.23 - 24.49 |
0.2517 times |
Mon 30 June 2025 |
24.36 (1.29%) |
24.03 |
24.00 - 24.50 |
1.274 times |
Fri 30 May 2025 |
24.05 (0.71%) |
23.88 |
23.73 - 24.06 |
0.4572 times |
Wed 30 April 2025 |
23.88 (-3.48%) |
24.74 |
23.36 - 24.81 |
2.2097 times |
Mon 31 March 2025 |
24.74 (-1.98%) |
25.22 |
24.70 - 25.22 |
0.2417 times |
Fri 28 February 2025 |
25.24 (0.12%) |
25.14 |
24.93 - 25.24 |
1.1541 times |
Fri 31 January 2025 |
25.21 (0.08%) |
25.22 |
24.99 - 25.29 |
2.5643 times |
Tue 31 December 2024 |
25.19 (-1.49%) |
25.44 |
25.05 - 25.44 |
0.2057 times |
DMA SMA EMA moving averages of Duke Energy DUKH
DMA (daily moving average) of Duke Energy DUKH
| DMA period | DMA value | | 5 day DMA | 24.45 | | 12 day DMA | 24.46 | | 20 day DMA | 24.54 | | 35 day DMA | 24.57 | | 50 day DMA | 24.53 | | 100 day DMA | 24.39 | | 150 day DMA | 24.29 | | 200 day DMA | 24.5 | EMA (exponential moving average) of Duke Energy DUKH
| EMA period | EMA current | EMA prev | EMA prev2 | | 5 day EMA | 24.46 | 24.43 | 24.42 | | 12 day EMA | 24.49 | 24.48 | 24.48 | | 20 day EMA | 24.5 | 24.5 | 24.5 | | 35 day EMA | 24.51 | 24.51 | 24.51 | | 50 day EMA | 24.51 | 24.51 | 24.51 |
SMA (simple moving average) of Duke Energy DUKH
| SMA period | SMA current | SMA prev | SMA prev2 | | 5 day SMA | 24.45 | 24.42 | 24.39 | | 12 day SMA | 24.46 | 24.48 | 24.5 | | 20 day SMA | 24.54 | 24.55 | 24.56 | | 35 day SMA | 24.57 | 24.57 | 24.57 | | 50 day SMA | 24.53 | 24.53 | 24.53 | | 100 day SMA | 24.39 | 24.38 | 24.38 | | 150 day SMA | 24.29 | 24.29 | 24.29 | | 200 day SMA | 24.5 | 24.5 | 24.5 |
|
|
