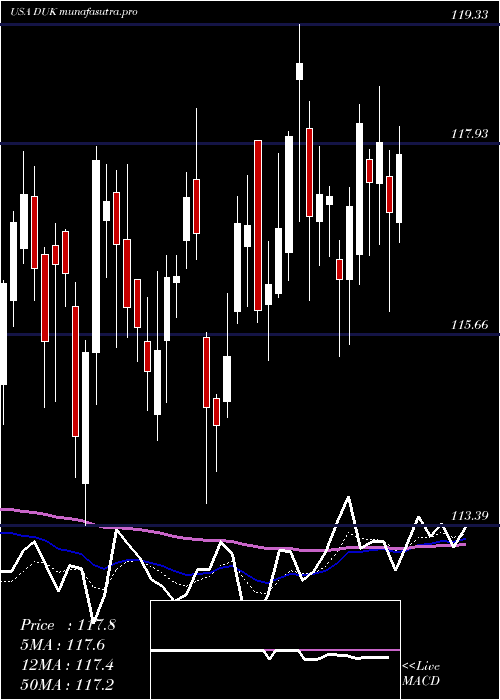
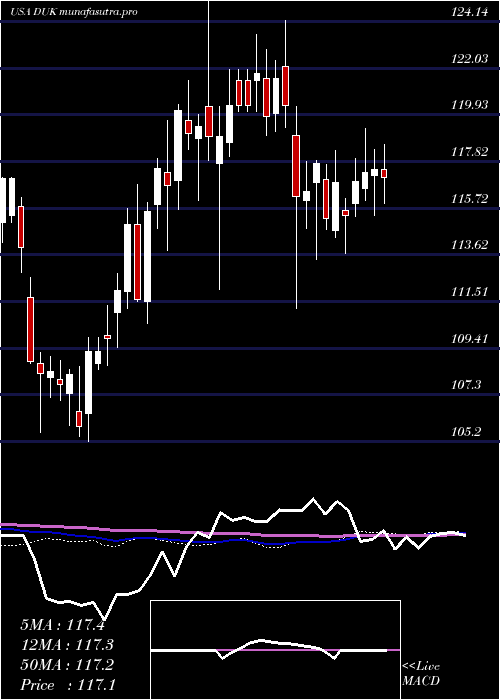
DukeEnergy DUK full analysis,charts,indicators,moving averages,SMA,DMA,EMA,ADX,MACD,RSIDuke Energy DUK WideScreen charts, DMA,SMA,EMA technical analysis, forecast prediction, by indicators ADX,MACD,RSI,CCI USA stock exchange
operates under Public Utilities sector & deals in Power Generation
Daily price and charts and targets DukeEnergy Strong Daily Stock price targets for DukeEnergy DUK are 127.56 and 129.07 | Daily Target 1 | 127.1 | | Daily Target 2 | 128.02 | | Daily Target 3 | 128.61 | | Daily Target 4 | 129.53 | | Daily Target 5 | 130.12 |
Daily price and volume Duke Energy
| Date |
Closing |
Open |
Range |
Volume |
Mon 20 October 2025 |
128.94 (0.32%) |
129.00 |
127.69 - 129.20 |
1.3851 times |
Fri 17 October 2025 |
128.53 (0.89%) |
128.17 |
127.12 - 128.65 |
1.1499 times |
Thu 16 October 2025 |
127.40 (-0.99%) |
128.84 |
127.40 - 129.51 |
1.0261 times |
Wed 15 October 2025 |
128.67 (0.66%) |
128.18 |
127.07 - 128.99 |
1.1139 times |
Tue 14 October 2025 |
127.82 (1.37%) |
126.91 |
126.29 - 128.49 |
0.9996 times |
Mon 13 October 2025 |
126.09 (-0.73%) |
126.21 |
125.69 - 126.95 |
0.7872 times |
Fri 10 October 2025 |
127.02 (1.85%) |
125.29 |
125.02 - 127.27 |
1.0889 times |
Thu 09 October 2025 |
124.71 (-0.42%) |
125.90 |
124.61 - 126.09 |
0.553 times |
Wed 08 October 2025 |
125.23 (-0.26%) |
126.26 |
124.40 - 126.32 |
0.8928 times |
Tue 07 October 2025 |
125.56 (0.95%) |
124.85 |
124.34 - 125.95 |
1.0034 times |
Mon 06 October 2025 |
124.38 (0.53%) |
123.08 |
122.78 - 124.69 |
0.5945 times |
Weekly price and charts DukeEnergy Strong weekly Stock price targets for DukeEnergy DUK are 127.56 and 129.07 | Weekly Target 1 | 127.1 | | Weekly Target 2 | 128.02 | | Weekly Target 3 | 128.61 | | Weekly Target 4 | 129.53 | | Weekly Target 5 | 130.12 |
Weekly price and volumes for Duke Energy
| Date |
Closing |
Open |
Range |
Volume |
Mon 20 October 2025 |
128.94 (0.32%) |
129.00 |
127.69 - 129.20 |
0.3521 times |
Fri 17 October 2025 |
128.53 (1.19%) |
126.21 |
125.69 - 129.51 |
1.2905 times |
Fri 10 October 2025 |
127.02 (2.66%) |
123.08 |
122.78 - 127.27 |
1.0505 times |
Fri 03 October 2025 |
123.73 (0.58%) |
123.05 |
120.94 - 123.93 |
1.3398 times |
Fri 26 September 2025 |
123.02 (1.6%) |
121.21 |
120.73 - 124.30 |
1.0572 times |
Fri 19 September 2025 |
121.08 (-0.71%) |
121.65 |
119.69 - 122.83 |
1.5157 times |
Fri 12 September 2025 |
121.95 (1.11%) |
120.40 |
119.76 - 122.89 |
1.0931 times |
Fri 05 September 2025 |
120.61 (-1.53%) |
122.46 |
120.04 - 122.77 |
0.904 times |
Fri 29 August 2025 |
122.49 (0%) |
122.40 |
122.11 - 123.19 |
0.2015 times |
Fri 29 August 2025 |
122.49 (-1.49%) |
123.95 |
122.10 - 124.22 |
1.1956 times |
Fri 22 August 2025 |
124.34 (1.54%) |
123.00 |
121.33 - 125.95 |
1.2978 times |
Monthly price and charts DukeEnergy Strong monthly Stock price targets for DukeEnergy DUK are 124.94 and 133.51 | Monthly Target 1 | 117.89 | | Monthly Target 2 | 123.42 | | Monthly Target 3 | 126.46333333333 | | Monthly Target 4 | 131.99 | | Monthly Target 5 | 135.03 |
Monthly price and volumes Duke Energy
| Date |
Closing |
Open |
Range |
Volume |
Mon 20 October 2025 |
128.94 (4.19%) |
123.56 |
120.94 - 129.51 |
0.531 times |
Tue 30 September 2025 |
123.75 (1.03%) |
122.46 |
119.69 - 124.30 |
0.8574 times |
Fri 29 August 2025 |
122.49 (0.7%) |
122.24 |
121.33 - 127.85 |
0.9971 times |
Thu 31 July 2025 |
121.64 (3.08%) |
118.68 |
115.40 - 121.97 |
0.9041 times |
Mon 30 June 2025 |
118.00 (0.24%) |
117.01 |
113.66 - 118.34 |
0.8236 times |
Fri 30 May 2025 |
117.72 (-3.52%) |
121.80 |
111.22 - 124.17 |
1.238 times |
Wed 30 April 2025 |
122.02 (0.04%) |
122.04 |
112.07 - 125.27 |
1.2269 times |
Mon 31 March 2025 |
121.97 (3.81%) |
117.32 |
113.81 - 122.50 |
1.3472 times |
Fri 28 February 2025 |
117.49 (4.91%) |
111.98 |
110.51 - 117.98 |
1.0569 times |
Fri 31 January 2025 |
111.99 (3.94%) |
108.48 |
105.20 - 112.76 |
1.0178 times |
Tue 31 December 2024 |
107.74 (-7.95%) |
115.80 |
105.63 - 116.21 |
0.821 times |

DMA SMA EMA moving averages of Duke Energy DUK
DMA (daily moving average) of Duke Energy DUK
| DMA period | DMA value | | 5 day DMA | 128.27 | | 12 day DMA | 126.51 | | 20 day DMA | 125.03 | | 35 day DMA | 123.38 | | 50 day DMA | 123.42 | | 100 day DMA | 120.84 | | 150 day DMA | 120.29 | | 200 day DMA | 118.41 | EMA (exponential moving average) of Duke Energy DUK
| EMA period | EMA current | EMA prev | EMA prev2 | | 5 day EMA | 128.08 | 127.65 | 127.21 | | 12 day EMA | 126.69 | 126.28 | 125.87 | | 20 day EMA | 125.61 | 125.26 | 124.92 | | 35 day EMA | 124.78 | 124.53 | 124.29 | | 50 day EMA | 124.04 | 123.84 | 123.65 |
SMA (simple moving average) of Duke Energy DUK
| SMA period | SMA current | SMA prev | SMA prev2 | | 5 day SMA | 128.27 | 127.7 | 127.4 | | 12 day SMA | 126.51 | 125.89 | 125.38 | | 20 day SMA | 125.03 | 124.67 | 124.29 | | 35 day SMA | 123.38 | 123.19 | 123.02 | | 50 day SMA | 123.42 | 123.35 | 123.28 | | 100 day SMA | 120.84 | 120.71 | 120.59 | | 150 day SMA | 120.29 | 120.23 | 120.17 | | 200 day SMA | 118.41 | 118.31 | 118.2 |
|
|
