DteEnergy DTW full analysis,charts,indicators,moving averages,SMA,DMA,EMA,ADX,MACD,RSIDte Energy DTW WideScreen charts, DMA,SMA,EMA technical analysis, forecast prediction, by indicators ADX,MACD,RSI,CCI USA stock exchange
operates under Public Utilities sector & deals in Electric Utilities Central
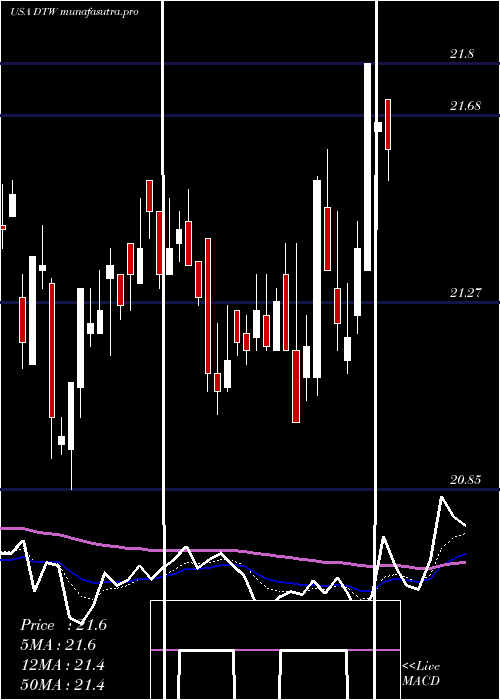
Daily price and charts and targets DteEnergy Strong Daily Stock price targets for DteEnergy DTW are 21.15 and 21.34 | Daily Target 1 | 21.01 | | Daily Target 2 | 21.09 | | Daily Target 3 | 21.196666666667 | | Daily Target 4 | 21.28 | | Daily Target 5 | 21.39 |
Daily price and volume Dte Energy
| Date |
Closing |
Open |
Range |
Volume |
Thu 04 December 2025 |
21.18 (-0.47%) |
21.17 |
21.11 - 21.30 |
0.9982 times |
Wed 03 December 2025 |
21.28 (0.66%) |
21.05 |
21.03 - 21.28 |
1.1675 times |
Tue 02 December 2025 |
21.14 (-0.28%) |
21.14 |
21.05 - 21.28 |
1.3263 times |
Mon 01 December 2025 |
21.20 (-0.47%) |
21.24 |
21.12 - 21.56 |
0.8254 times |
Fri 28 November 2025 |
21.30 (-0.79%) |
21.43 |
21.30 - 21.60 |
1.739 times |
Wed 26 November 2025 |
21.47 (0.42%) |
21.35 |
21.35 - 21.57 |
0.9277 times |
Tue 25 November 2025 |
21.38 (0.75%) |
21.34 |
21.20 - 21.43 |
0.7302 times |
Mon 24 November 2025 |
21.22 (-0.05%) |
21.30 |
21.21 - 21.42 |
0.7266 times |
Fri 21 November 2025 |
21.23 (0.05%) |
21.22 |
21.15 - 21.38 |
0.6455 times |
Thu 20 November 2025 |
21.22 (-0.89%) |
21.45 |
21.18 - 21.58 |
0.9136 times |
Wed 19 November 2025 |
21.41 (-0.6%) |
21.40 |
21.31 - 21.54 |
0.8501 times |
Weekly price and charts DteEnergy Strong weekly Stock price targets for DteEnergy DTW are 20.84 and 21.37 | Weekly Target 1 | 20.73 | | Weekly Target 2 | 20.95 | | Weekly Target 3 | 21.256666666667 | | Weekly Target 4 | 21.48 | | Weekly Target 5 | 21.79 |
Weekly price and volumes for Dte Energy
| Date |
Closing |
Open |
Range |
Volume |
Thu 04 December 2025 |
21.18 (-0.56%) |
21.24 |
21.03 - 21.56 |
1.1672 times |
Fri 28 November 2025 |
21.30 (0.33%) |
21.30 |
21.20 - 21.60 |
1.1148 times |
Fri 21 November 2025 |
21.23 (-2.44%) |
21.84 |
21.15 - 21.85 |
1.1424 times |
Fri 14 November 2025 |
21.76 (-1.09%) |
22.01 |
21.67 - 22.41 |
1.1062 times |
Fri 07 November 2025 |
22.00 (-0.32%) |
22.00 |
21.83 - 22.13 |
0.8678 times |
Fri 31 October 2025 |
22.07 (0%) |
22.22 |
21.94 - 22.43 |
0.6189 times |
Fri 31 October 2025 |
22.07 (-1.78%) |
22.51 |
21.94 - 22.56 |
1.1233 times |
Fri 24 October 2025 |
22.47 (0.63%) |
22.27 |
22.23 - 22.60 |
0.7915 times |
Fri 17 October 2025 |
22.33 (1.22%) |
22.11 |
21.93 - 22.33 |
1.5506 times |
Fri 10 October 2025 |
22.06 (-1.74%) |
22.45 |
21.99 - 22.45 |
0.5174 times |
Fri 03 October 2025 |
22.45 (-0.97%) |
22.68 |
22.21 - 22.68 |
1.2094 times |
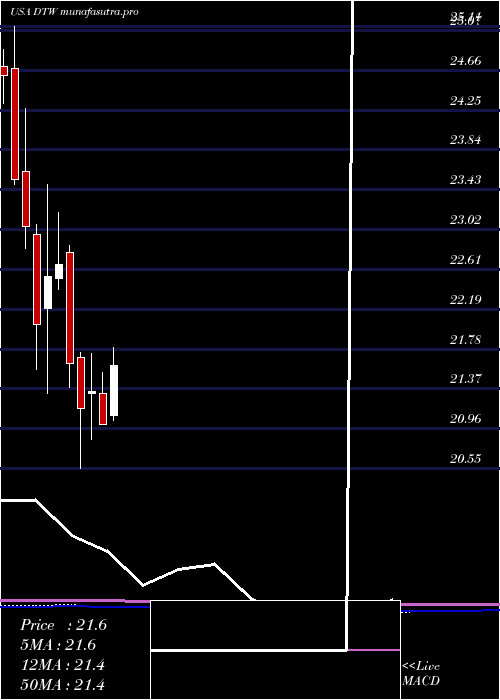
Monthly price and charts DteEnergy Strong monthly Stock price targets for DteEnergy DTW are 20.84 and 21.37 | Monthly Target 1 | 20.73 | | Monthly Target 2 | 20.95 | | Monthly Target 3 | 21.256666666667 | | Monthly Target 4 | 21.48 | | Monthly Target 5 | 21.79 |
Monthly price and volumes Dte Energy
| Date |
Closing |
Open |
Range |
Volume |
Thu 04 December 2025 |
21.18 (-0.56%) |
21.24 |
21.03 - 21.56 |
0.2734 times |
Fri 28 November 2025 |
21.30 (-3.49%) |
22.00 |
21.15 - 22.41 |
0.9909 times |
Fri 31 October 2025 |
22.07 (-0.94%) |
22.32 |
21.93 - 22.62 |
1.2088 times |
Tue 30 September 2025 |
22.28 (-1.81%) |
22.70 |
22.21 - 23.14 |
1.0226 times |
Fri 29 August 2025 |
22.69 (0.44%) |
22.55 |
22.46 - 23.23 |
1.1149 times |
Thu 31 July 2025 |
22.59 (7.57%) |
21.10 |
21.05 - 22.67 |
1.2733 times |
Mon 30 June 2025 |
21.00 (-1.64%) |
21.33 |
21.00 - 21.54 |
0.9797 times |
Fri 30 May 2025 |
21.35 (0.85%) |
21.32 |
20.85 - 21.74 |
1.0054 times |
Wed 30 April 2025 |
21.17 (-2.13%) |
21.70 |
20.55 - 21.75 |
0.9771 times |
Mon 31 March 2025 |
21.63 (-4.55%) |
22.78 |
21.39 - 22.85 |
1.1539 times |
Fri 28 February 2025 |
22.66 (0.58%) |
22.51 |
22.40 - 23.19 |
0.7593 times |
DMA SMA EMA moving averages of Dte Energy DTW
DMA (daily moving average) of Dte Energy DTW
| DMA period | DMA value | | 5 day DMA | 21.22 | | 12 day DMA | 21.3 | | 20 day DMA | 21.59 | | 35 day DMA | 21.9 | | 50 day DMA | 22.04 | | 100 day DMA | 22.3 | | 150 day DMA | 21.97 | | 200 day DMA | 21.93 | EMA (exponential moving average) of Dte Energy DTW
| EMA period | EMA current | EMA prev | EMA prev2 | | 5 day EMA | 21.23 | 21.26 | 21.25 | | 12 day EMA | 21.37 | 21.4 | 21.42 | | 20 day EMA | 21.52 | 21.56 | 21.59 | | 35 day EMA | 21.77 | 21.8 | 21.83 | | 50 day EMA | 22.02 | 22.05 | 22.08 |
SMA (simple moving average) of Dte Energy DTW
| SMA period | SMA current | SMA prev | SMA prev2 | | 5 day SMA | 21.22 | 21.28 | 21.3 | | 12 day SMA | 21.3 | 21.32 | 21.36 | | 20 day SMA | 21.59 | 21.63 | 21.67 | | 35 day SMA | 21.9 | 21.93 | 21.95 | | 50 day SMA | 22.04 | 22.07 | 22.1 | | 100 day SMA | 22.3 | 22.3 | 22.3 | | 150 day SMA | 21.97 | 21.97 | 21.97 | | 200 day SMA | 21.93 | 21.94 | 21.94 |
|
|
