DariohealthCorp DRIO full analysis,charts,indicators,moving averages,SMA,DMA,EMA,ADX,MACD,RSIDariohealth Corp DRIO WideScreen charts, DMA,SMA,EMA technical analysis, forecast prediction, by indicators ADX,MACD,RSI,CCI USA stock exchange
operates under Health Care sector & deals in Medical Dental Instruments
Daily price and charts and targets DariohealthCorp Strong Daily Stock price targets for DariohealthCorp DRIO are 14.7 and 17.81 | Daily Target 1 | 12.19 | | Daily Target 2 | 14.09 | | Daily Target 3 | 15.296666666667 | | Daily Target 4 | 17.2 | | Daily Target 5 | 18.41 |
Daily price and volume Dariohealth Corp
| Date |
Closing |
Open |
Range |
Volume |
Mon 20 October 2025 |
16.00 (22.79%) |
13.39 |
13.39 - 16.50 |
2.1506 times |
Fri 17 October 2025 |
13.03 (-0.08%) |
12.65 |
12.22 - 13.34 |
0.515 times |
Thu 16 October 2025 |
13.04 (-3.41%) |
13.39 |
12.64 - 13.72 |
0.7921 times |
Wed 15 October 2025 |
13.50 (-6.12%) |
14.19 |
13.38 - 14.35 |
0.4022 times |
Tue 14 October 2025 |
14.38 (-3.75%) |
14.77 |
14.01 - 14.77 |
0.4438 times |
Mon 13 October 2025 |
14.94 (-2.35%) |
15.30 |
14.71 - 15.98 |
0.9662 times |
Fri 10 October 2025 |
15.30 (-2.49%) |
15.65 |
15.09 - 15.65 |
0.7332 times |
Thu 09 October 2025 |
15.69 (-4.15%) |
16.40 |
15.30 - 16.55 |
1.3904 times |
Wed 08 October 2025 |
16.37 (5.27%) |
15.08 |
14.62 - 16.39 |
0.9564 times |
Tue 07 October 2025 |
15.55 (-1.64%) |
15.80 |
14.79 - 15.84 |
1.6503 times |
Mon 06 October 2025 |
15.81 (-3.3%) |
15.79 |
15.60 - 16.35 |
0.564 times |
Weekly price and charts DariohealthCorp Strong weekly Stock price targets for DariohealthCorp DRIO are 14.7 and 17.81 | Weekly Target 1 | 12.19 | | Weekly Target 2 | 14.09 | | Weekly Target 3 | 15.296666666667 | | Weekly Target 4 | 17.2 | | Weekly Target 5 | 18.41 |
Weekly price and volumes for Dariohealth Corp
| Date |
Closing |
Open |
Range |
Volume |
Mon 20 October 2025 |
16.00 (22.79%) |
13.39 |
13.39 - 16.50 |
0.1707 times |
Fri 17 October 2025 |
13.03 (-14.84%) |
15.30 |
12.22 - 15.98 |
0.2475 times |
Fri 10 October 2025 |
15.30 (-6.42%) |
15.79 |
14.62 - 16.55 |
0.4201 times |
Fri 03 October 2025 |
16.35 (23.21%) |
13.27 |
13.04 - 17.74 |
1.1018 times |
Fri 26 September 2025 |
13.27 (101.06%) |
6.61 |
6.46 - 15.83 |
3.8037 times |
Fri 19 September 2025 |
6.60 (-7.17%) |
7.05 |
5.93 - 7.85 |
0.5466 times |
Fri 12 September 2025 |
7.11 (-25.94%) |
9.59 |
7.04 - 9.59 |
0.3326 times |
Fri 05 September 2025 |
9.60 (0.95%) |
9.33 |
8.91 - 10.60 |
0.5754 times |
Fri 29 August 2025 |
9.51 (0%) |
10.13 |
9.51 - 10.18 |
0.0082 times |
Fri 29 August 2025 |
9.51 (1568.42%) |
0.54 |
0.48 - 11.13 |
2.7935 times |
Fri 22 August 2025 |
0.57 (26.67%) |
0.45 |
0.42 - 0.58 |
2.6725 times |
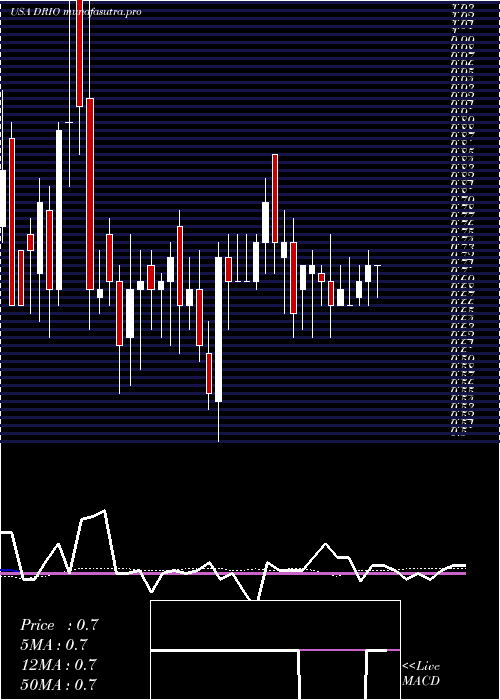
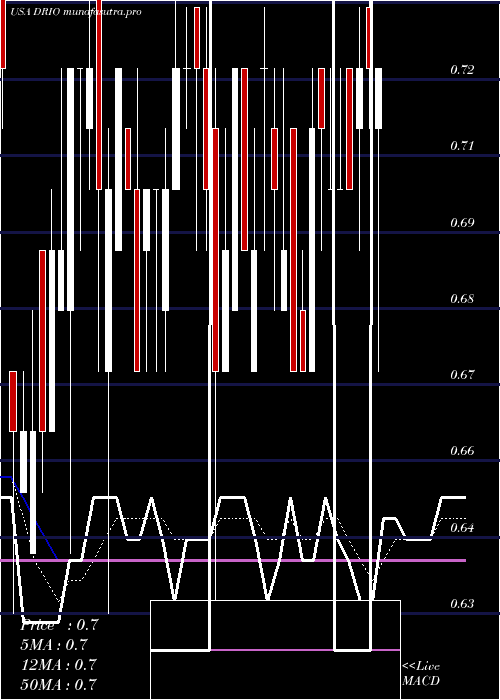
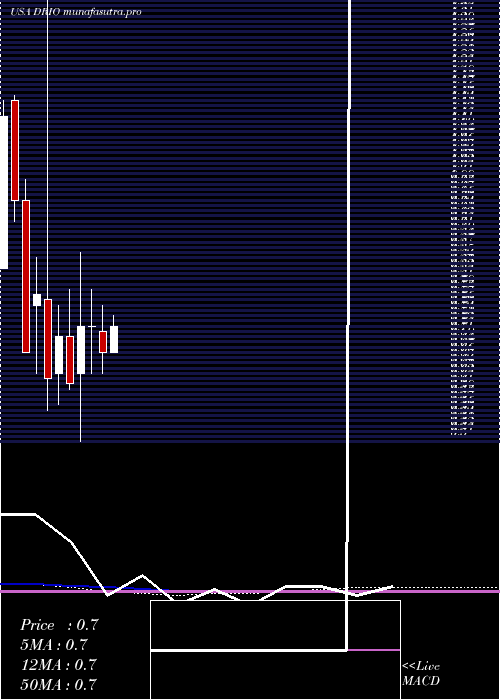
Monthly price and charts DariohealthCorp Strong monthly Stock price targets for DariohealthCorp DRIO are 11.35 and 16.87 | Monthly Target 1 | 9.8 | | Monthly Target 2 | 12.9 | | Monthly Target 3 | 15.32 | | Monthly Target 4 | 18.42 | | Monthly Target 5 | 20.84 |
Monthly price and volumes Dariohealth Corp
| Date |
Closing |
Open |
Range |
Volume |
Mon 20 October 2025 |
16.00 (-7.78%) |
17.00 |
12.22 - 17.74 |
0.0738 times |
Tue 30 September 2025 |
17.35 (82.44%) |
9.33 |
5.93 - 17.35 |
0.4524 times |
Fri 29 August 2025 |
9.51 (1568.42%) |
0.58 |
0.38 - 11.13 |
0.7117 times |
Thu 31 July 2025 |
0.57 (-14.93%) |
0.67 |
0.52 - 0.74 |
0.5158 times |
Mon 30 June 2025 |
0.67 (-6.94%) |
0.71 |
0.63 - 0.76 |
0.488 times |
Fri 30 May 2025 |
0.72 (0%) |
0.72 |
0.63 - 0.79 |
0.4599 times |
Wed 30 April 2025 |
0.72 (18.03%) |
0.63 |
0.50 - 0.86 |
0.8077 times |
Mon 31 March 2025 |
0.61 (-12.86%) |
0.70 |
0.60 - 0.79 |
0.7315 times |
Fri 28 February 2025 |
0.70 (12.9%) |
0.63 |
0.57 - 0.76 |
1.5287 times |
Fri 31 January 2025 |
0.62 (-20.51%) |
0.77 |
0.56 - 1.55 |
4.2304 times |
Tue 31 December 2024 |
0.78 (16.42%) |
0.76 |
0.63 - 0.85 |
0.5052 times |
DMA SMA EMA moving averages of Dariohealth Corp DRIO
DMA (daily moving average) of Dariohealth Corp DRIO
| DMA period | DMA value | | 5 day DMA | 13.99 | | 12 day DMA | 15 | | 20 day DMA | 14.63 | | 35 day DMA | 11.75 | | 50 day DMA | 8.92 | | 100 day DMA | 4.8 | | 150 day DMA | 3.43 | | 200 day DMA | 2.75 | EMA (exponential moving average) of Dariohealth Corp DRIO
| EMA period | EMA current | EMA prev | EMA prev2 | | 5 day EMA | 14.47 | 13.71 | 14.05 | | 12 day EMA | 14.4 | 14.11 | 14.31 | | 20 day EMA | 13.59 | 13.34 | 13.37 | | 35 day EMA | 11.47 | 11.2 | 11.09 | | 50 day EMA | 8.75 | 8.45 | 8.26 |
SMA (simple moving average) of Dariohealth Corp DRIO
| SMA period | SMA current | SMA prev | SMA prev2 | | 5 day SMA | 13.99 | 13.78 | 14.23 | | 12 day SMA | 15 | 15.08 | 15.43 | | 20 day SMA | 14.63 | 14.22 | 13.89 | | 35 day SMA | 11.75 | 11.56 | 11.46 | | 50 day SMA | 8.92 | 8.61 | 8.36 | | 100 day SMA | 4.8 | 4.64 | 4.52 | | 150 day SMA | 3.43 | 3.32 | 3.24 | | 200 day SMA | 2.75 | 2.67 | 2.61 |
|
|
