DardenRestaurants DRI full analysis,charts,indicators,moving averages,SMA,DMA,EMA,ADX,MACD,RSIDarden Restaurants DRI WideScreen charts, DMA,SMA,EMA technical analysis, forecast prediction, by indicators ADX,MACD,RSI,CCI USA stock exchange
operates under Consumer Services sector & deals in Restaurants
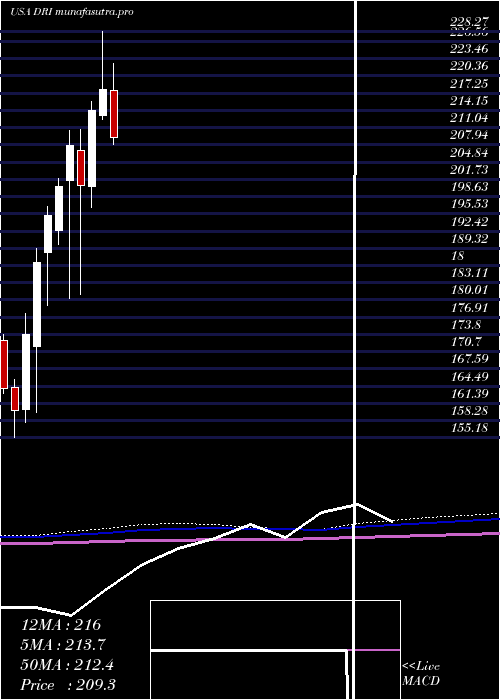
Daily price and charts and targets DardenRestaurants Strong Daily Stock price targets for DardenRestaurants DRI are 173.83 and 177.5 | Daily Target 1 | 173.01 | | Daily Target 2 | 174.64 | | Daily Target 3 | 176.68333333333 | | Daily Target 4 | 178.31 | | Daily Target 5 | 180.35 |
Daily price and volume Darden Restaurants
| Date |
Closing |
Open |
Range |
Volume |
Thu 04 December 2025 |
176.26 (-0.6%) |
178.03 |
175.06 - 178.73 |
0.6992 times |
Wed 03 December 2025 |
177.32 (1.53%) |
175.46 |
174.72 - 178.92 |
0.7221 times |
Tue 02 December 2025 |
174.64 (0.4%) |
175.64 |
174.08 - 175.93 |
1.2537 times |
Mon 01 December 2025 |
173.94 (-3.14%) |
178.66 |
173.91 - 179.22 |
1.4942 times |
Fri 28 November 2025 |
179.58 (-0.23%) |
179.58 |
179.44 - 180.92 |
0.2622 times |
Wed 26 November 2025 |
180.00 (0.4%) |
179.69 |
179.07 - 181.63 |
0.8889 times |
Tue 25 November 2025 |
179.28 (3.44%) |
174.36 |
174.16 - 179.52 |
1.0595 times |
Mon 24 November 2025 |
173.32 (-0.8%) |
174.28 |
172.70 - 175.86 |
1.0837 times |
Fri 21 November 2025 |
174.72 (3.26%) |
169.95 |
169.53 - 175.38 |
1.4937 times |
Thu 20 November 2025 |
169.21 (-0.46%) |
170.81 |
169.00 - 171.13 |
1.0429 times |
Wed 19 November 2025 |
170.00 (-0.61%) |
171.29 |
169.98 - 172.38 |
0.6893 times |
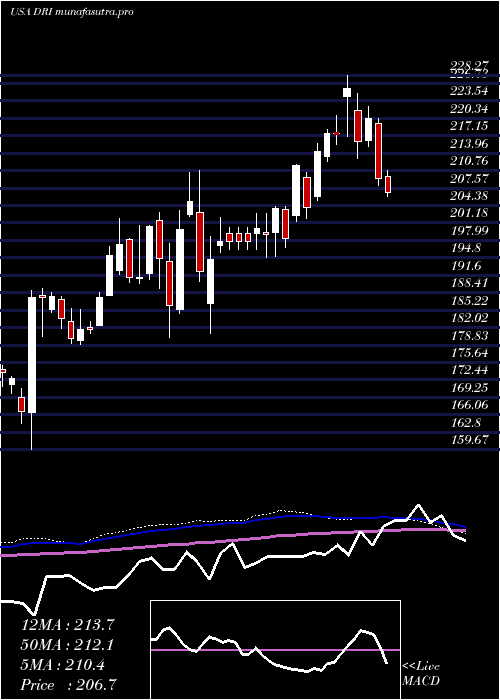
Weekly price and charts DardenRestaurants Strong weekly Stock price targets for DardenRestaurants DRI are 172.43 and 177.74 | Weekly Target 1 | 171.15 | | Weekly Target 2 | 173.71 | | Weekly Target 3 | 176.46333333333 | | Weekly Target 4 | 179.02 | | Weekly Target 5 | 181.77 |
Weekly price and volumes for Darden Restaurants
| Date |
Closing |
Open |
Range |
Volume |
Thu 04 December 2025 |
176.26 (-1.85%) |
178.66 |
173.91 - 179.22 |
1.1676 times |
Fri 28 November 2025 |
179.58 (2.78%) |
174.28 |
172.70 - 181.63 |
0.9225 times |
Fri 21 November 2025 |
174.72 (0.51%) |
174.95 |
169.00 - 175.56 |
1.4548 times |
Fri 14 November 2025 |
173.83 (-2.38%) |
178.98 |
170.64 - 179.11 |
1.393 times |
Fri 07 November 2025 |
178.06 (-1.16%) |
177.57 |
176.22 - 182.02 |
0.9434 times |
Fri 31 October 2025 |
180.15 (0%) |
177.92 |
177.00 - 180.76 |
0.2497 times |
Fri 31 October 2025 |
180.15 (-2.53%) |
184.72 |
177.00 - 185.45 |
1.1694 times |
Fri 24 October 2025 |
184.82 (-1.79%) |
191.26 |
184.29 - 191.50 |
0.771 times |
Fri 17 October 2025 |
188.19 (3.87%) |
183.40 |
182.21 - 191.26 |
1.0214 times |
Fri 10 October 2025 |
181.17 (-6.22%) |
193.40 |
181.11 - 196.56 |
0.9072 times |
Fri 03 October 2025 |
193.18 (2.69%) |
189.02 |
188.09 - 194.31 |
1.0142 times |
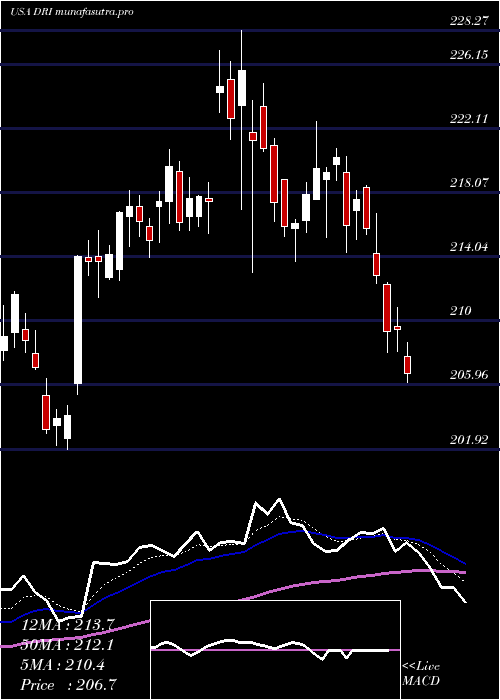
Monthly price and charts DardenRestaurants Strong monthly Stock price targets for DardenRestaurants DRI are 172.43 and 177.74 | Monthly Target 1 | 171.15 | | Monthly Target 2 | 173.71 | | Monthly Target 3 | 176.46333333333 | | Monthly Target 4 | 179.02 | | Monthly Target 5 | 181.77 |
Monthly price and volumes Darden Restaurants
| Date |
Closing |
Open |
Range |
Volume |
Thu 04 December 2025 |
176.26 (-1.85%) |
178.66 |
173.91 - 179.22 |
0.2436 times |
Fri 28 November 2025 |
179.58 (-0.32%) |
177.57 |
169.00 - 182.02 |
0.9835 times |
Fri 31 October 2025 |
180.15 (-5.36%) |
190.11 |
177.00 - 196.56 |
0.9618 times |
Tue 30 September 2025 |
190.36 (-8.01%) |
205.73 |
182.76 - 215.28 |
1.3029 times |
Fri 29 August 2025 |
206.94 (2.61%) |
200.74 |
199.80 - 211.63 |
0.7437 times |
Thu 31 July 2025 |
201.67 (-7.48%) |
217.66 |
200.92 - 222.56 |
1.0012 times |
Mon 30 June 2025 |
217.97 (1.76%) |
213.26 |
212.53 - 228.27 |
1.2441 times |
Fri 30 May 2025 |
214.21 (6.76%) |
200.48 |
196.69 - 215.68 |
1.4418 times |
Wed 30 April 2025 |
200.64 (-3.43%) |
206.94 |
181.00 - 210.74 |
0.9796 times |
Mon 31 March 2025 |
207.76 (3.64%) |
201.59 |
180.22 - 210.47 |
1.0978 times |
Fri 28 February 2025 |
200.46 (2.67%) |
192.51 |
190.06 - 201.94 |
0.8551 times |
DMA SMA EMA moving averages of Darden Restaurants DRI
DMA (daily moving average) of Darden Restaurants DRI
| DMA period | DMA value | | 5 day DMA | 176.35 | | 12 day DMA | 174.94 | | 20 day DMA | 174.84 | | 35 day DMA | 178.65 | | 50 day DMA | 181.82 | | 100 day DMA | 193.45 | | 150 day DMA | 199.78 | | 200 day DMA | 198.98 | EMA (exponential moving average) of Darden Restaurants DRI
| EMA period | EMA current | EMA prev | EMA prev2 | | 5 day EMA | 176.29 | 176.3 | 175.79 | | 12 day EMA | 175.93 | 175.87 | 175.61 | | 20 day EMA | 176.5 | 176.52 | 176.44 | | 35 day EMA | 178.75 | 178.9 | 178.99 | | 50 day EMA | 181.71 | 181.93 | 182.12 |
SMA (simple moving average) of Darden Restaurants DRI
| SMA period | SMA current | SMA prev | SMA prev2 | | 5 day SMA | 176.35 | 177.1 | 177.49 | | 12 day SMA | 174.94 | 174.57 | 174.28 | | 20 day SMA | 174.84 | 175.03 | 175.18 | | 35 day SMA | 178.65 | 178.99 | 179.27 | | 50 day SMA | 181.82 | 182.03 | 182.22 | | 100 day SMA | 193.45 | 193.75 | 194.07 | | 150 day SMA | 199.78 | 199.94 | 200.08 | | 200 day SMA | 198.98 | 199.09 | 199.2 |
|
|
