DormanProducts DORM full analysis,charts,indicators,moving averages,SMA,DMA,EMA,ADX,MACD,RSIDorman Products DORM WideScreen charts, DMA,SMA,EMA technical analysis, forecast prediction, by indicators ADX,MACD,RSI,CCI USA stock exchange
operates under Capital Goods sector & deals in Auto Parts O E M
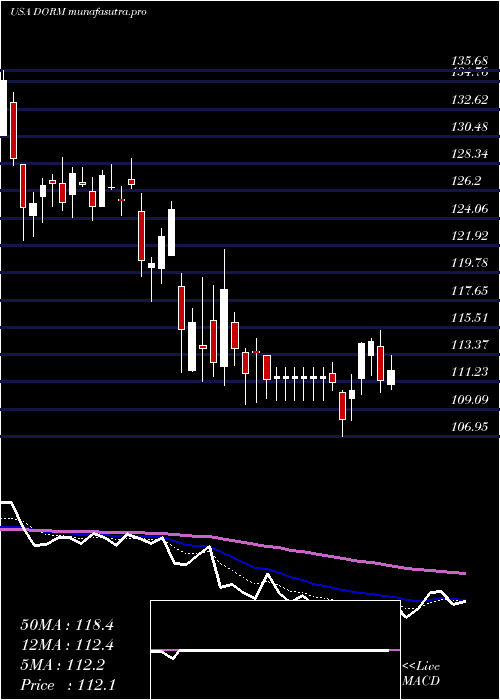
Daily price and charts and targets DormanProducts Strong Daily Stock price targets for DormanProducts DORM are 141 and 144.33 | Daily Target 1 | 140.06 | | Daily Target 2 | 141.93 | | Daily Target 3 | 143.38666666667 | | Daily Target 4 | 145.26 | | Daily Target 5 | 146.72 |
Daily price and volume Dorman Products
| Date |
Closing |
Open |
Range |
Volume |
Mon 20 October 2025 |
143.81 (0.53%) |
144.84 |
141.51 - 144.84 |
0.6475 times |
Fri 17 October 2025 |
143.05 (0.39%) |
142.49 |
141.69 - 144.45 |
0.7363 times |
Thu 16 October 2025 |
142.49 (0.9%) |
141.75 |
140.12 - 142.49 |
0.837 times |
Wed 15 October 2025 |
141.22 (0.83%) |
140.86 |
138.85 - 141.60 |
0.7256 times |
Tue 14 October 2025 |
140.06 (1.21%) |
136.68 |
135.99 - 140.93 |
1.3397 times |
Mon 13 October 2025 |
138.39 (-2.32%) |
142.71 |
138.02 - 143.61 |
0.83 times |
Fri 10 October 2025 |
141.68 (-0.9%) |
142.79 |
141.51 - 144.85 |
0.7578 times |
Thu 09 October 2025 |
142.96 (-0.29%) |
142.88 |
139.51 - 143.91 |
1.288 times |
Wed 08 October 2025 |
143.37 (0.26%) |
142.61 |
140.55 - 144.91 |
1.0539 times |
Tue 07 October 2025 |
143.00 (-3.12%) |
147.93 |
142.64 - 148.18 |
1.7843 times |
Mon 06 October 2025 |
147.61 (-6.07%) |
156.83 |
147.10 - 156.95 |
1.1922 times |
Weekly price and charts DormanProducts Strong weekly Stock price targets for DormanProducts DORM are 141 and 144.33 | Weekly Target 1 | 140.06 | | Weekly Target 2 | 141.93 | | Weekly Target 3 | 143.38666666667 | | Weekly Target 4 | 145.26 | | Weekly Target 5 | 146.72 |
Weekly price and volumes for Dorman Products
| Date |
Closing |
Open |
Range |
Volume |
Mon 20 October 2025 |
143.81 (0.53%) |
144.84 |
141.51 - 144.84 |
0.1801 times |
Fri 17 October 2025 |
143.05 (0.97%) |
142.71 |
135.99 - 144.45 |
1.2426 times |
Fri 10 October 2025 |
141.68 (-9.84%) |
156.83 |
139.51 - 156.95 |
1.6897 times |
Fri 03 October 2025 |
157.15 (1.19%) |
155.59 |
151.36 - 158.17 |
0.949 times |
Fri 26 September 2025 |
155.30 (-0.73%) |
156.92 |
148.33 - 158.56 |
0.9425 times |
Fri 19 September 2025 |
156.44 (-3.03%) |
163.06 |
155.82 - 163.06 |
1.3187 times |
Fri 12 September 2025 |
161.33 (-1.43%) |
164.54 |
157.01 - 166.89 |
0.9843 times |
Fri 05 September 2025 |
163.67 (1.16%) |
160.07 |
157.78 - 165.00 |
1.0831 times |
Fri 29 August 2025 |
161.79 (0%) |
162.19 |
160.42 - 162.19 |
0.2079 times |
Fri 29 August 2025 |
161.79 (-0.58%) |
161.65 |
159.63 - 165.05 |
1.4022 times |
Fri 22 August 2025 |
162.73 (6.72%) |
152.29 |
151.48 - 163.45 |
1.4121 times |
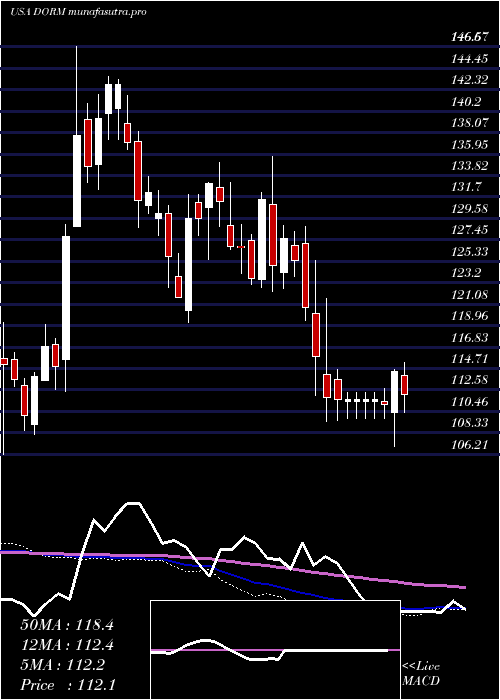
Monthly price and charts DormanProducts Strong monthly Stock price targets for DormanProducts DORM are 128.81 and 150.99 | Monthly Target 1 | 123.81 | | Monthly Target 2 | 133.81 | | Monthly Target 3 | 145.99 | | Monthly Target 4 | 155.99 | | Monthly Target 5 | 168.17 |
Monthly price and volumes Dorman Products
| Date |
Closing |
Open |
Range |
Volume |
Mon 20 October 2025 |
143.81 (-7.74%) |
154.77 |
135.99 - 158.17 |
0.592 times |
Tue 30 September 2025 |
155.88 (-3.65%) |
160.07 |
148.33 - 166.89 |
0.7817 times |
Fri 29 August 2025 |
161.79 (34.13%) |
118.71 |
117.86 - 165.05 |
1.3509 times |
Thu 31 July 2025 |
120.62 (-1.67%) |
121.77 |
119.83 - 128.66 |
0.8361 times |
Mon 30 June 2025 |
122.67 (-5.13%) |
128.48 |
120.38 - 129.55 |
0.8724 times |
Fri 30 May 2025 |
129.31 (14.13%) |
114.01 |
113.11 - 132.91 |
1.0715 times |
Wed 30 April 2025 |
113.30 (-6.01%) |
120.10 |
106.95 - 125.40 |
1.5705 times |
Mon 31 March 2025 |
120.54 (-8.31%) |
130.91 |
117.50 - 135.68 |
1.0943 times |
Fri 28 February 2025 |
131.46 (0.14%) |
128.86 |
122.70 - 133.15 |
0.802 times |
Fri 31 January 2025 |
131.28 (1.34%) |
129.63 |
119.28 - 135.15 |
1.0285 times |
Tue 31 December 2024 |
129.55 (-9.3%) |
138.95 |
128.69 - 141.80 |
0.5413 times |

DMA SMA EMA moving averages of Dorman Products DORM
DMA (daily moving average) of Dorman Products DORM
| DMA period | DMA value | | 5 day DMA | 142.13 | | 12 day DMA | 143.73 | | 20 day DMA | 148.09 | | 35 day DMA | 153.4 | | 50 day DMA | 154.72 | | 100 day DMA | 140.16 | | 150 day DMA | 133.25 | | 200 day DMA | 131.94 | EMA (exponential moving average) of Dorman Products DORM
| EMA period | EMA current | EMA prev | EMA prev2 | | 5 day EMA | 142.78 | 142.26 | 141.86 | | 12 day EMA | 144.52 | 144.65 | 144.94 | | 20 day EMA | 146.99 | 147.32 | 147.77 | | 35 day EMA | 149.49 | 149.82 | 150.22 | | 50 day EMA | 152.15 | 152.49 | 152.87 |
SMA (simple moving average) of Dorman Products DORM
| SMA period | SMA current | SMA prev | SMA prev2 | | 5 day SMA | 142.13 | 141.04 | 140.77 | | 12 day SMA | 143.73 | 144.73 | 145.74 | | 20 day SMA | 148.09 | 148.73 | 149.4 | | 35 day SMA | 153.4 | 153.91 | 154.44 | | 50 day SMA | 154.72 | 154.7 | 154.63 | | 100 day SMA | 140.16 | 140 | 139.82 | | 150 day SMA | 133.25 | 133.13 | 133.03 | | 200 day SMA | 131.94 | 131.87 | 131.8 |
|
|
