WesternAsset DMO full analysis,charts,indicators,moving averages,SMA,DMA,EMA,ADX,MACD,RSIWestern Asset DMO WideScreen charts, DMA,SMA,EMA technical analysis, forecast prediction, by indicators ADX,MACD,RSI,CCI USA stock exchange
operates under N A sector & deals in N A
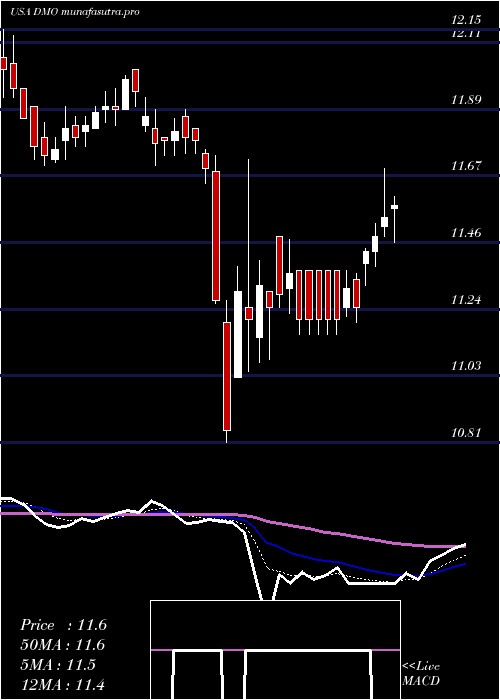
Daily price and charts and targets WesternAsset Strong Daily Stock price targets for WesternAsset DMO are 11.44 and 11.62 | Daily Target 1 | 11.4 | | Daily Target 2 | 11.47 | | Daily Target 3 | 11.583333333333 | | Daily Target 4 | 11.65 | | Daily Target 5 | 11.76 |
Daily price and volume Western Asset
| Date |
Closing |
Open |
Range |
Volume |
Thu 04 December 2025 |
11.53 (-0.35%) |
11.57 |
11.52 - 11.70 |
1.0066 times |
Wed 03 December 2025 |
11.57 (0.09%) |
11.57 |
11.52 - 11.62 |
1.0892 times |
Tue 02 December 2025 |
11.56 (-0.17%) |
11.62 |
11.55 - 11.62 |
0.7823 times |
Mon 01 December 2025 |
11.58 (-0.34%) |
11.64 |
11.56 - 11.68 |
1.0031 times |
Fri 28 November 2025 |
11.62 (0.17%) |
11.65 |
11.57 - 11.67 |
0.6173 times |
Wed 26 November 2025 |
11.60 (-0.51%) |
11.70 |
11.57 - 11.70 |
1.274 times |
Tue 25 November 2025 |
11.66 (-0.77%) |
11.72 |
11.66 - 11.78 |
1.7011 times |
Mon 24 November 2025 |
11.75 (-0.51%) |
11.81 |
11.75 - 11.84 |
0.5275 times |
Fri 21 November 2025 |
11.81 (0.51%) |
11.77 |
11.76 - 11.84 |
0.9385 times |
Thu 20 November 2025 |
11.75 (-2.08%) |
11.89 |
11.75 - 11.90 |
1.0605 times |
Wed 19 November 2025 |
12.00 (0.5%) |
11.97 |
11.94 - 12.05 |
0.6567 times |
Weekly price and charts WesternAsset Strong weekly Stock price targets for WesternAsset DMO are 11.44 and 11.62 | Weekly Target 1 | 11.4 | | Weekly Target 2 | 11.47 | | Weekly Target 3 | 11.583333333333 | | Weekly Target 4 | 11.65 | | Weekly Target 5 | 11.76 |
Weekly price and volumes for Western Asset
| Date |
Closing |
Open |
Range |
Volume |
Thu 04 December 2025 |
11.53 (-0.77%) |
11.64 |
11.52 - 11.70 |
1.2132 times |
Fri 28 November 2025 |
11.62 (-1.61%) |
11.81 |
11.57 - 11.84 |
1.2878 times |
Fri 21 November 2025 |
11.81 (-1.25%) |
11.95 |
11.75 - 12.07 |
1.3478 times |
Fri 14 November 2025 |
11.96 (0%) |
12.02 |
11.91 - 12.03 |
0.6674 times |
Fri 07 November 2025 |
11.96 (0.08%) |
11.96 |
11.85 - 12.03 |
0.585 times |
Fri 31 October 2025 |
11.95 (0%) |
11.88 |
11.83 - 11.95 |
0.1251 times |
Fri 31 October 2025 |
11.95 (0.25%) |
11.93 |
11.83 - 12.00 |
0.986 times |
Fri 24 October 2025 |
11.92 (0.25%) |
11.92 |
11.82 - 12.08 |
1.2076 times |
Fri 17 October 2025 |
11.89 (-0.25%) |
12.00 |
11.84 - 12.07 |
1.4314 times |
Fri 10 October 2025 |
11.92 (1.45%) |
11.77 |
11.75 - 11.98 |
1.1487 times |
Fri 03 October 2025 |
11.75 (0.43%) |
11.70 |
11.66 - 11.88 |
1.2453 times |
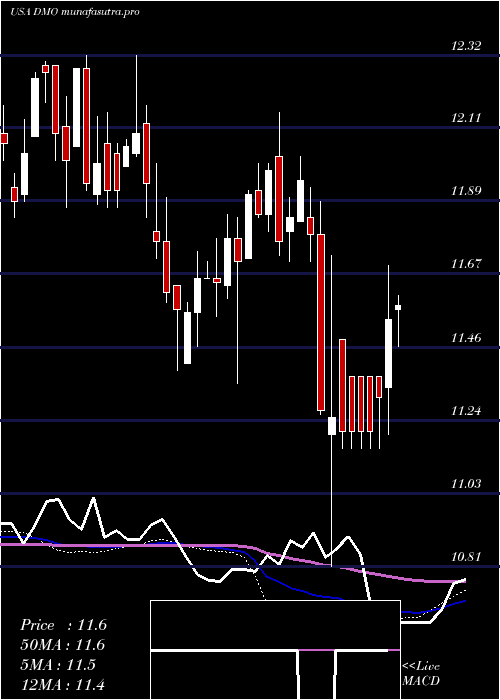
Monthly price and charts WesternAsset Strong monthly Stock price targets for WesternAsset DMO are 11.44 and 11.62 | Monthly Target 1 | 11.4 | | Monthly Target 2 | 11.47 | | Monthly Target 3 | 11.583333333333 | | Monthly Target 4 | 11.65 | | Monthly Target 5 | 11.76 |
Monthly price and volumes Western Asset
| Date |
Closing |
Open |
Range |
Volume |
Thu 04 December 2025 |
11.53 (-0.77%) |
11.64 |
11.52 - 11.70 |
0.2119 times |
Fri 28 November 2025 |
11.62 (-2.76%) |
11.96 |
11.57 - 12.07 |
0.6791 times |
Fri 31 October 2025 |
11.95 (1.96%) |
11.74 |
11.72 - 12.08 |
0.9938 times |
Tue 30 September 2025 |
11.72 (-1.51%) |
11.91 |
11.66 - 12.11 |
1.1132 times |
Fri 29 August 2025 |
11.90 (0.42%) |
11.87 |
11.75 - 11.97 |
1.2193 times |
Thu 31 July 2025 |
11.85 (-0.75%) |
11.95 |
11.79 - 12.05 |
1.0493 times |
Mon 30 June 2025 |
11.94 (2.23%) |
11.71 |
11.70 - 12.00 |
0.8803 times |
Fri 30 May 2025 |
11.68 (-0.26%) |
11.79 |
11.45 - 11.89 |
0.9686 times |
Wed 30 April 2025 |
11.71 (-0.93%) |
11.87 |
10.81 - 11.89 |
1.5719 times |
Mon 31 March 2025 |
11.82 (-1.34%) |
12.02 |
11.71 - 12.15 |
1.3125 times |
Fri 28 February 2025 |
11.98 (1.7%) |
11.78 |
11.35 - 12.00 |
1.0193 times |

DMA SMA EMA moving averages of Western Asset DMO
DMA (daily moving average) of Western Asset DMO
| DMA period | DMA value | | 5 day DMA | 11.57 | | 12 day DMA | 11.7 | | 20 day DMA | 11.81 | | 35 day DMA | 11.87 | | 50 day DMA | 11.86 | | 100 day DMA | 11.88 | | 150 day DMA | 11.85 | | 200 day DMA | 11.8 | EMA (exponential moving average) of Western Asset DMO
| EMA period | EMA current | EMA prev | EMA prev2 | | 5 day EMA | 11.58 | 11.6 | 11.62 | | 12 day EMA | 11.67 | 11.7 | 11.72 | | 20 day EMA | 11.75 | 11.77 | 11.79 | | 35 day EMA | 11.79 | 11.81 | 11.82 | | 50 day EMA | 11.85 | 11.86 | 11.87 |
SMA (simple moving average) of Western Asset DMO
| SMA period | SMA current | SMA prev | SMA prev2 | | 5 day SMA | 11.57 | 11.59 | 11.6 | | 12 day SMA | 11.7 | 11.74 | 11.77 | | 20 day SMA | 11.81 | 11.83 | 11.85 | | 35 day SMA | 11.87 | 11.88 | 11.89 | | 50 day SMA | 11.86 | 11.87 | 11.88 | | 100 day SMA | 11.88 | 11.89 | 11.89 | | 150 day SMA | 11.85 | 11.85 | 11.85 | | 200 day SMA | 11.8 | 11.8 | 11.8 |
|
|
