DickS DKS full analysis,charts,indicators,moving averages,SMA,DMA,EMA,ADX,MACD,RSIDick S DKS WideScreen charts, DMA,SMA,EMA technical analysis, forecast prediction, by indicators ADX,MACD,RSI,CCI USA stock exchange
operates under Consumer Services sector & deals in Other Specialty Stores
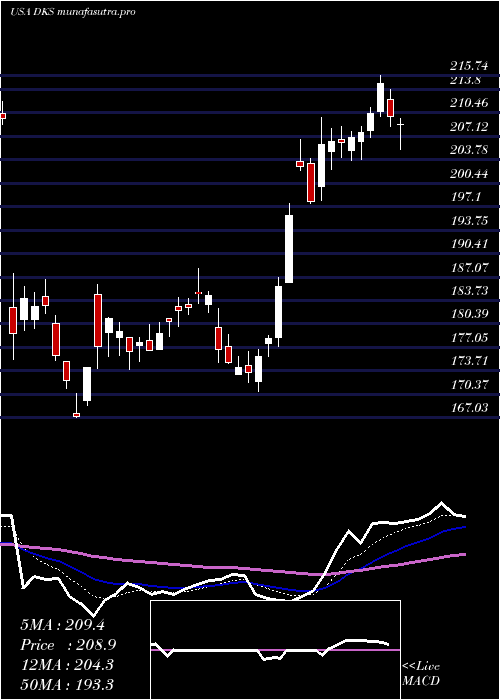
Daily price and charts and targets DickS Strong Daily Stock price targets for DickS DKS are 221.28 and 229.02 | Daily Target 1 | 219.77 | | Daily Target 2 | 222.78 | | Daily Target 3 | 227.51 | | Daily Target 4 | 230.52 | | Daily Target 5 | 235.25 |
Daily price and volume Dick S
| Date |
Closing |
Open |
Range |
Volume |
Mon 20 October 2025 |
225.79 (-1.34%) |
229.83 |
224.50 - 232.24 |
0.6494 times |
Fri 17 October 2025 |
228.86 (-0.66%) |
231.40 |
226.60 - 232.92 |
0.7915 times |
Thu 16 October 2025 |
230.37 (-1.64%) |
234.20 |
229.20 - 234.24 |
0.9215 times |
Wed 15 October 2025 |
234.20 (1.71%) |
232.97 |
231.75 - 236.87 |
0.738 times |
Tue 14 October 2025 |
230.26 (0.24%) |
223.68 |
223.32 - 233.30 |
1.1766 times |
Mon 13 October 2025 |
229.71 (8.57%) |
217.38 |
216.17 - 231.30 |
1.6932 times |
Fri 10 October 2025 |
211.58 (-5.47%) |
224.51 |
211.58 - 224.51 |
1.4035 times |
Thu 09 October 2025 |
223.82 (-1.46%) |
227.66 |
222.22 - 228.28 |
0.9461 times |
Wed 08 October 2025 |
227.14 (0.98%) |
226.43 |
224.28 - 229.21 |
0.9081 times |
Tue 07 October 2025 |
224.93 (-2.17%) |
229.70 |
223.76 - 230.15 |
0.7721 times |
Mon 06 October 2025 |
229.93 (-0.64%) |
232.30 |
226.46 - 233.05 |
0.4768 times |
Weekly price and charts DickS Strong weekly Stock price targets for DickS DKS are 221.28 and 229.02 | Weekly Target 1 | 219.77 | | Weekly Target 2 | 222.78 | | Weekly Target 3 | 227.51 | | Weekly Target 4 | 230.52 | | Weekly Target 5 | 235.25 |
Weekly price and volumes for Dick S
| Date |
Closing |
Open |
Range |
Volume |
Mon 20 October 2025 |
225.79 (-1.34%) |
229.83 |
224.50 - 232.24 |
0.0893 times |
Fri 17 October 2025 |
228.86 (8.17%) |
217.38 |
216.17 - 236.87 |
0.7315 times |
Fri 10 October 2025 |
211.58 (-8.57%) |
232.30 |
211.58 - 233.05 |
0.6196 times |
Fri 03 October 2025 |
231.41 (1.38%) |
228.00 |
216.02 - 237.31 |
0.934 times |
Fri 26 September 2025 |
228.27 (2.85%) |
221.32 |
216.35 - 234.30 |
0.9343 times |
Fri 19 September 2025 |
221.95 (0.2%) |
221.52 |
220.20 - 228.52 |
0.9905 times |
Fri 12 September 2025 |
221.50 (0.12%) |
222.36 |
219.11 - 231.30 |
1.3056 times |
Fri 05 September 2025 |
221.24 (3.97%) |
211.00 |
205.88 - 223.42 |
1.4312 times |
Fri 29 August 2025 |
212.80 (0%) |
215.95 |
208.42 - 216.36 |
0.5469 times |
Fri 29 August 2025 |
212.80 (-6.51%) |
226.84 |
208.42 - 232.27 |
2.4171 times |
Fri 22 August 2025 |
227.63 (1.63%) |
225.23 |
218.50 - 229.39 |
0.9394 times |
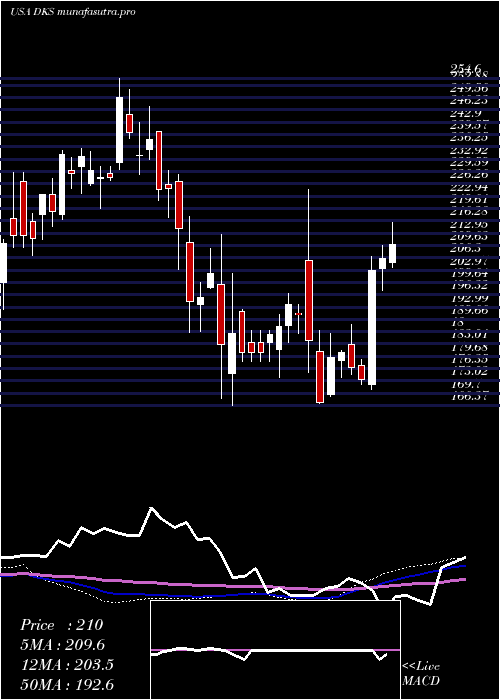
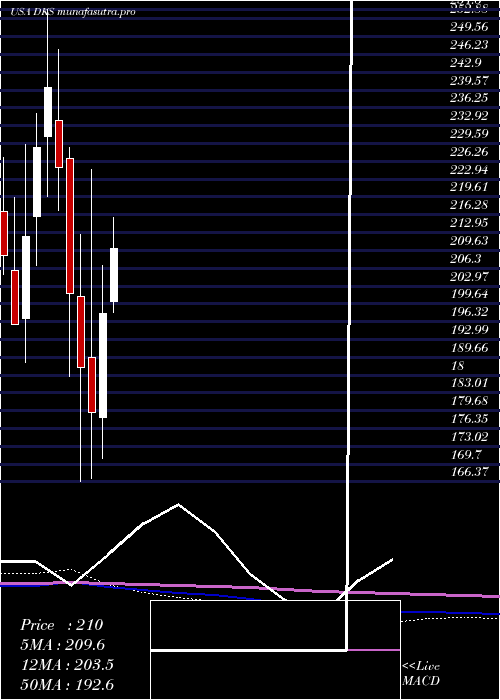
Monthly price and charts DickS Strong monthly Stock price targets for DickS DKS are 218.69 and 244.42 | Monthly Target 1 | 199.16 | | Monthly Target 2 | 212.48 | | Monthly Target 3 | 224.89333333333 | | Monthly Target 4 | 238.21 | | Monthly Target 5 | 250.62 |
Monthly price and volumes Dick S
| Date |
Closing |
Open |
Range |
Volume |
Mon 20 October 2025 |
225.79 (1.61%) |
222.28 |
211.58 - 237.31 |
0.4709 times |
Tue 30 September 2025 |
222.22 (4.43%) |
211.00 |
205.88 - 234.30 |
1.2558 times |
Fri 29 August 2025 |
212.80 (0.61%) |
207.00 |
202.52 - 232.27 |
1.346 times |
Thu 31 July 2025 |
211.51 (6.93%) |
200.00 |
198.04 - 220.89 |
0.9038 times |
Mon 30 June 2025 |
197.81 (10.3%) |
178.49 |
170.73 - 206.72 |
0.975 times |
Fri 30 May 2025 |
179.34 (-4.47%) |
189.67 |
167.03 - 224.64 |
1.5509 times |
Wed 30 April 2025 |
187.74 (-6.86%) |
200.98 |
166.37 - 212.62 |
0.9969 times |
Mon 31 March 2025 |
201.56 (-10.46%) |
226.84 |
186.09 - 228.81 |
1.147 times |
Fri 28 February 2025 |
225.10 (-6.23%) |
233.87 |
217.09 - 247.19 |
0.589 times |
Fri 31 January 2025 |
240.05 (4.9%) |
230.90 |
219.68 - 254.60 |
0.7647 times |
Tue 31 December 2024 |
228.84 (7.83%) |
216.00 |
206.89 - 235.16 |
0.584 times |
DMA SMA EMA moving averages of Dick S DKS
DMA (daily moving average) of Dick S DKS
| DMA period | DMA value | | 5 day DMA | 229.9 | | 12 day DMA | 227.33 | | 20 day DMA | 227.22 | | 35 day DMA | 224.88 | | 50 day DMA | 224.24 | | 100 day DMA | 211.23 | | 150 day DMA | 203.9 | | 200 day DMA | 210.02 | EMA (exponential moving average) of Dick S DKS
| EMA period | EMA current | EMA prev | EMA prev2 | | 5 day EMA | 228.06 | 229.2 | 229.37 | | 12 day EMA | 227.5 | 227.81 | 227.62 | | 20 day EMA | 226.74 | 226.84 | 226.63 | | 35 day EMA | 225.33 | 225.3 | 225.09 | | 50 day EMA | 223.9 | 223.82 | 223.61 |
SMA (simple moving average) of Dick S DKS
| SMA period | SMA current | SMA prev | SMA prev2 | | 5 day SMA | 229.9 | 230.68 | 227.22 | | 12 day SMA | 227.33 | 227.6 | 227.93 | | 20 day SMA | 227.22 | 226.89 | 226.55 | | 35 day SMA | 224.88 | 224.51 | 224.05 | | 50 day SMA | 224.24 | 223.96 | 223.61 | | 100 day SMA | 211.23 | 210.71 | 210.09 | | 150 day SMA | 203.9 | 203.69 | 203.41 | | 200 day SMA | 210.02 | 210.03 | 210.03 |
|
|
