DiodesIncorporated DIOD full analysis,charts,indicators,moving averages,SMA,DMA,EMA,ADX,MACD,RSIDiodes Incorporated DIOD WideScreen charts, DMA,SMA,EMA technical analysis, forecast prediction, by indicators ADX,MACD,RSI,CCI USA stock exchange
operates under Technology sector & deals in Semiconductors
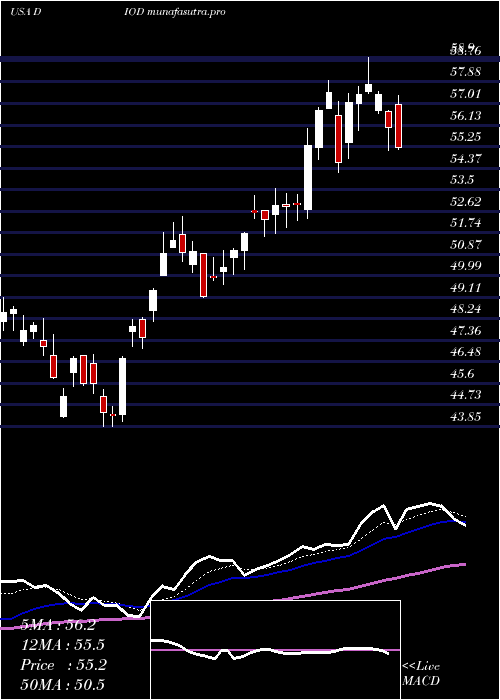
Daily price and charts and targets DiodesIncorporated Strong Daily Stock price targets for DiodesIncorporated DIOD are 56.13 and 58.26 | Daily Target 1 | 54.37 | | Daily Target 2 | 55.76 | | Daily Target 3 | 56.503333333333 | | Daily Target 4 | 57.89 | | Daily Target 5 | 58.63 |
Daily price and volume Diodes Incorporated
| Date |
Closing |
Open |
Range |
Volume |
Mon 20 October 2025 |
57.14 (4.81%) |
55.53 |
55.12 - 57.25 |
1.0407 times |
Fri 17 October 2025 |
54.52 (-2.21%) |
54.67 |
53.50 - 55.46 |
0.8239 times |
Thu 16 October 2025 |
55.75 (0.32%) |
56.15 |
54.90 - 56.19 |
1.0653 times |
Wed 15 October 2025 |
55.57 (3.35%) |
54.85 |
53.96 - 55.59 |
1.1989 times |
Tue 14 October 2025 |
53.77 (4.25%) |
50.50 |
50.50 - 55.04 |
1.2294 times |
Mon 13 October 2025 |
51.58 (6.64%) |
50.25 |
49.81 - 51.94 |
1.4837 times |
Fri 10 October 2025 |
48.37 (-7.85%) |
52.45 |
48.25 - 53.05 |
0.975 times |
Thu 09 October 2025 |
52.49 (-0.17%) |
52.44 |
51.49 - 52.54 |
0.6862 times |
Wed 08 October 2025 |
52.58 (3.04%) |
51.01 |
51.01 - 52.80 |
0.6517 times |
Tue 07 October 2025 |
51.03 (-3.75%) |
53.43 |
50.64 - 53.79 |
0.8452 times |
Mon 06 October 2025 |
53.02 (0.84%) |
53.58 |
52.70 - 53.58 |
0.9591 times |
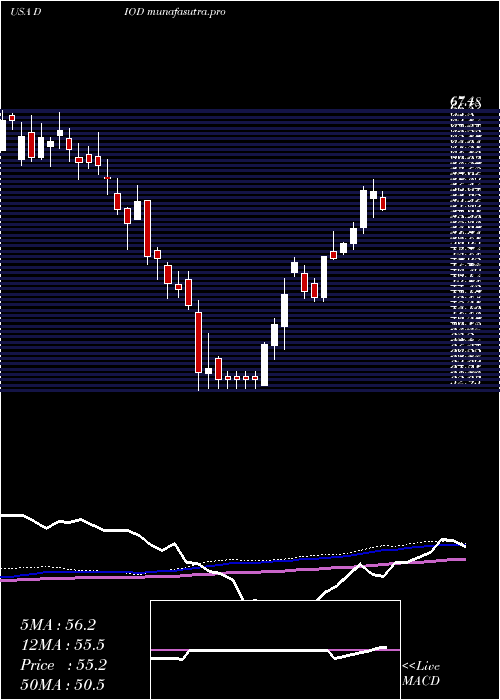
Weekly price and charts DiodesIncorporated Strong weekly Stock price targets for DiodesIncorporated DIOD are 56.13 and 58.26 | Weekly Target 1 | 54.37 | | Weekly Target 2 | 55.76 | | Weekly Target 3 | 56.503333333333 | | Weekly Target 4 | 57.89 | | Weekly Target 5 | 58.63 |
Weekly price and volumes for Diodes Incorporated
| Date |
Closing |
Open |
Range |
Volume |
Mon 20 October 2025 |
57.14 (4.81%) |
55.53 |
55.12 - 57.25 |
0.1814 times |
Fri 17 October 2025 |
54.52 (12.71%) |
50.25 |
49.81 - 56.19 |
1.0115 times |
Fri 10 October 2025 |
48.37 (-8.01%) |
53.58 |
48.25 - 53.79 |
0.7179 times |
Fri 03 October 2025 |
52.58 (-0.98%) |
53.87 |
50.95 - 53.93 |
1.1643 times |
Fri 26 September 2025 |
53.10 (-1.56%) |
54.03 |
51.60 - 55.79 |
1.1645 times |
Fri 19 September 2025 |
53.94 (2.51%) |
52.96 |
52.64 - 56.87 |
1.8422 times |
Fri 12 September 2025 |
52.62 (-0.83%) |
53.60 |
52.13 - 54.38 |
1.0552 times |
Fri 05 September 2025 |
53.06 (-2.53%) |
52.98 |
51.50 - 54.38 |
1.1559 times |
Fri 29 August 2025 |
54.44 (0%) |
55.73 |
54.20 - 55.89 |
0.3392 times |
Fri 29 August 2025 |
54.44 (-3.2%) |
56.09 |
54.20 - 56.58 |
1.3678 times |
Fri 22 August 2025 |
56.24 (6.62%) |
52.78 |
51.22 - 56.49 |
1.3546 times |
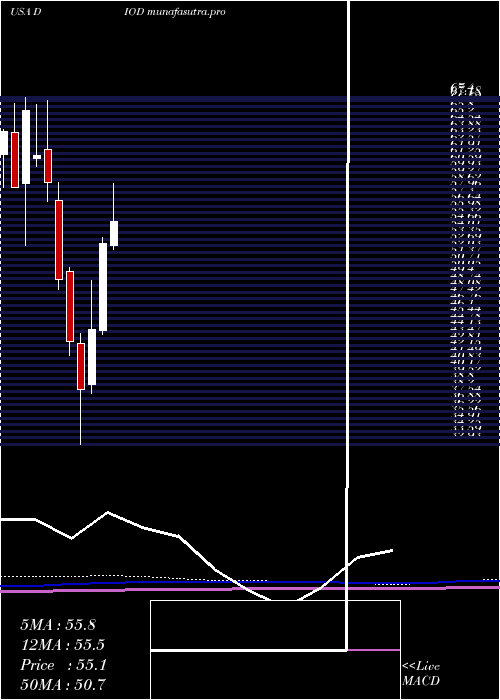
Monthly price and charts DiodesIncorporated Strong monthly Stock price targets for DiodesIncorporated DIOD are 52.7 and 61.7 | Monthly Target 1 | 45.21 | | Monthly Target 2 | 51.18 | | Monthly Target 3 | 54.213333333333 | | Monthly Target 4 | 60.18 | | Monthly Target 5 | 63.21 |
Monthly price and volumes Diodes Incorporated
| Date |
Closing |
Open |
Range |
Volume |
Mon 20 October 2025 |
57.14 (7.39%) |
52.50 |
48.25 - 57.25 |
0.4431 times |
Tue 30 September 2025 |
53.21 (-2.26%) |
52.98 |
51.50 - 56.87 |
1.0061 times |
Fri 29 August 2025 |
54.44 (10.27%) |
48.45 |
46.72 - 56.58 |
1.0787 times |
Thu 31 July 2025 |
49.37 (-6.66%) |
52.70 |
48.99 - 58.90 |
0.9206 times |
Mon 30 June 2025 |
52.89 (19.12%) |
44.32 |
43.85 - 53.53 |
1.0022 times |
Fri 30 May 2025 |
44.40 (15.63%) |
38.92 |
37.97 - 49.26 |
1.0477 times |
Wed 30 April 2025 |
38.40 (-11.05%) |
43.01 |
32.93 - 43.96 |
1.2425 times |
Mon 31 March 2025 |
43.17 (-12.58%) |
50.15 |
41.80 - 50.49 |
1.2578 times |
Fri 28 February 2025 |
49.38 (-16.28%) |
57.20 |
48.39 - 58.99 |
0.9974 times |
Fri 31 January 2025 |
58.98 (-4.36%) |
62.28 |
57.05 - 67.12 |
1.0039 times |
Tue 31 December 2024 |
61.67 (-6.77%) |
61.33 |
60.55 - 66.77 |
0.5556 times |
DMA SMA EMA moving averages of Diodes Incorporated DIOD
DMA (daily moving average) of Diodes Incorporated DIOD
| DMA period | DMA value | | 5 day DMA | 55.35 | | 12 day DMA | 53.2 | | 20 day DMA | 53.23 | | 35 day DMA | 53.46 | | 50 day DMA | 53.71 | | 100 day DMA | 52.69 | | 150 day DMA | 48.8 | | 200 day DMA | 50.59 | EMA (exponential moving average) of Diodes Incorporated DIOD
| EMA period | EMA current | EMA prev | EMA prev2 | | 5 day EMA | 55.2 | 54.23 | 54.08 | | 12 day EMA | 54 | 53.43 | 53.23 | | 20 day EMA | 53.65 | 53.28 | 53.15 | | 35 day EMA | 53.4 | 53.18 | 53.1 | | 50 day EMA | 53.53 | 53.38 | 53.33 |
SMA (simple moving average) of Diodes Incorporated DIOD
| SMA period | SMA current | SMA prev | SMA prev2 | | 5 day SMA | 55.35 | 54.24 | 53.01 | | 12 day SMA | 53.2 | 52.83 | 52.58 | | 20 day SMA | 53.23 | 53.12 | 53.09 | | 35 day SMA | 53.46 | 53.39 | 53.39 | | 50 day SMA | 53.71 | 53.58 | 53.51 | | 100 day SMA | 52.69 | 52.59 | 52.49 | | 150 day SMA | 48.8 | 48.72 | 48.67 | | 200 day SMA | 50.59 | 50.61 | 50.65 |
|
|
