DellTechnologies DELL full analysis,charts,indicators,moving averages,SMA,DMA,EMA,ADX,MACD,RSIDell Technologies DELL WideScreen charts, DMA,SMA,EMA technical analysis, forecast prediction, by indicators ADX,MACD,RSI,CCI USA stock exchange
operates under Technology sector & deals in Computer Manufacturing
Daily price and charts and targets DellTechnologies Strong Daily Stock price targets for DellTechnologies DELL are 145.22 and 149.77 | Daily Target 1 | 144.34 | | Daily Target 2 | 146.09 | | Daily Target 3 | 148.88666666667 | | Daily Target 4 | 150.64 | | Daily Target 5 | 153.44 |
Daily price and volume Dell Technologies
| Date |
Closing |
Open |
Range |
Volume |
Mon 20 October 2025 |
147.85 (-1.36%) |
151.16 |
147.13 - 151.68 |
0.3897 times |
Fri 17 October 2025 |
149.89 (-0.28%) |
146.47 |
145.50 - 151.28 |
0.3851 times |
Thu 16 October 2025 |
150.31 (-2.21%) |
155.13 |
149.67 - 158.50 |
0.5321 times |
Wed 15 October 2025 |
153.70 (3.31%) |
152.16 |
151.42 - 155.78 |
0.6128 times |
Tue 14 October 2025 |
148.77 (-3.02%) |
149.98 |
148.10 - 152.56 |
0.7491 times |
Mon 13 October 2025 |
153.40 (1.88%) |
155.55 |
151.11 - 155.55 |
0.7179 times |
Fri 10 October 2025 |
150.57 (-3.45%) |
157.57 |
150.42 - 159.28 |
1.2403 times |
Thu 09 October 2025 |
155.95 (-5.21%) |
164.32 |
155.15 - 164.94 |
1.4014 times |
Wed 08 October 2025 |
164.53 (9.05%) |
154.71 |
154.00 - 166.10 |
1.9992 times |
Tue 07 October 2025 |
150.87 (3.58%) |
152.80 |
144.40 - 154.70 |
1.9723 times |
Mon 06 October 2025 |
145.65 (2.57%) |
142.50 |
142.01 - 149.28 |
0.8294 times |
Weekly price and charts DellTechnologies Strong weekly Stock price targets for DellTechnologies DELL are 145.22 and 149.77 | Weekly Target 1 | 144.34 | | Weekly Target 2 | 146.09 | | Weekly Target 3 | 148.88666666667 | | Weekly Target 4 | 150.64 | | Weekly Target 5 | 153.44 |
Weekly price and volumes for Dell Technologies
| Date |
Closing |
Open |
Range |
Volume |
Mon 20 October 2025 |
147.85 (-1.36%) |
151.16 |
147.13 - 151.68 |
0.1106 times |
Fri 17 October 2025 |
149.89 (-0.45%) |
155.55 |
145.50 - 158.50 |
0.8502 times |
Fri 10 October 2025 |
150.57 (6.04%) |
142.50 |
142.01 - 166.10 |
2.1113 times |
Fri 03 October 2025 |
142.00 (8.6%) |
132.13 |
132.13 - 152.10 |
1.1098 times |
Fri 26 September 2025 |
130.76 (-0.89%) |
132.62 |
127.12 - 137.98 |
0.8242 times |
Fri 19 September 2025 |
131.94 (5.52%) |
126.39 |
125.01 - 133.97 |
0.9885 times |
Fri 12 September 2025 |
125.04 (0.17%) |
125.30 |
118.15 - 128.76 |
1.0432 times |
Fri 05 September 2025 |
124.83 (2.19%) |
119.11 |
117.70 - 128.42 |
0.8503 times |
Fri 29 August 2025 |
122.15 (0%) |
124.03 |
119.63 - 124.90 |
0.7293 times |
Fri 29 August 2025 |
122.15 (-6.64%) |
130.49 |
119.63 - 135.18 |
1.3826 times |
Fri 22 August 2025 |
130.84 (-5.38%) |
138.28 |
126.84 - 139.38 |
0.6539 times |
Monthly price and charts DellTechnologies Strong monthly Stock price targets for DellTechnologies DELL are 144.13 and 169.83 | Monthly Target 1 | 125.75 | | Monthly Target 2 | 136.8 | | Monthly Target 3 | 151.45 | | Monthly Target 4 | 162.5 | | Monthly Target 5 | 177.15 |
Monthly price and volumes Dell Technologies
| Date |
Closing |
Open |
Range |
Volume |
Mon 20 October 2025 |
147.85 (4.29%) |
140.91 |
140.40 - 166.10 |
0.8691 times |
Tue 30 September 2025 |
141.77 (16.06%) |
119.11 |
117.70 - 141.77 |
0.9495 times |
Fri 29 August 2025 |
122.15 (-7.94%) |
128.38 |
119.63 - 142.11 |
0.9844 times |
Thu 31 July 2025 |
132.69 (8.23%) |
122.06 |
120.11 - 136.14 |
0.6969 times |
Mon 30 June 2025 |
122.60 (10.18%) |
110.99 |
106.38 - 127.15 |
0.8083 times |
Fri 30 May 2025 |
111.27 (21.26%) |
93.57 |
91.79 - 116.97 |
0.9359 times |
Wed 30 April 2025 |
91.76 (0.67%) |
91.28 |
66.25 - 95.72 |
1.3538 times |
Mon 31 March 2025 |
91.15 (-11.3%) |
103.64 |
88.33 - 103.77 |
0.9719 times |
Fri 28 February 2025 |
102.76 (-0.81%) |
99.38 |
98.37 - 122.26 |
1.1944 times |
Fri 31 January 2025 |
103.60 (-10.1%) |
115.26 |
100.04 - 125.77 |
1.2357 times |
Tue 31 December 2024 |
115.24 (-18.7%) |
125.16 |
110.17 - 128.68 |
0.7389 times |
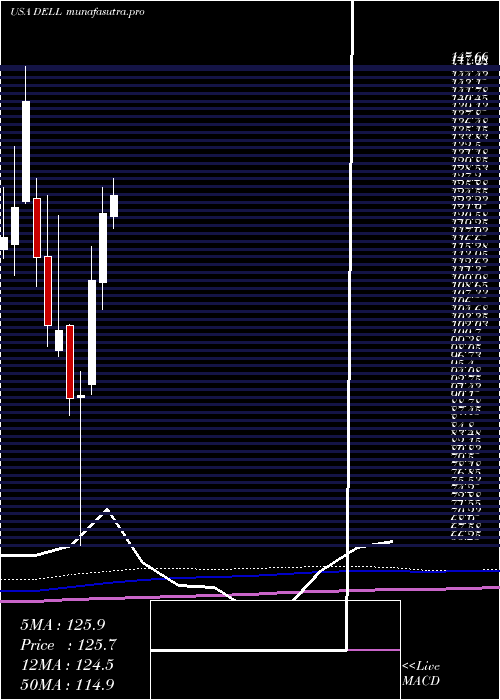
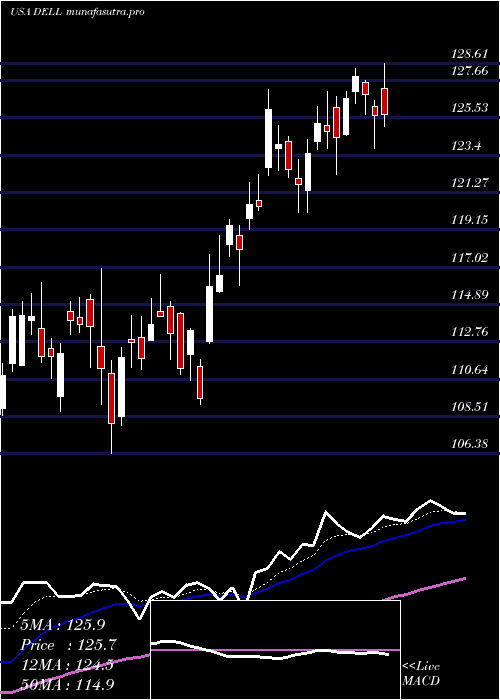
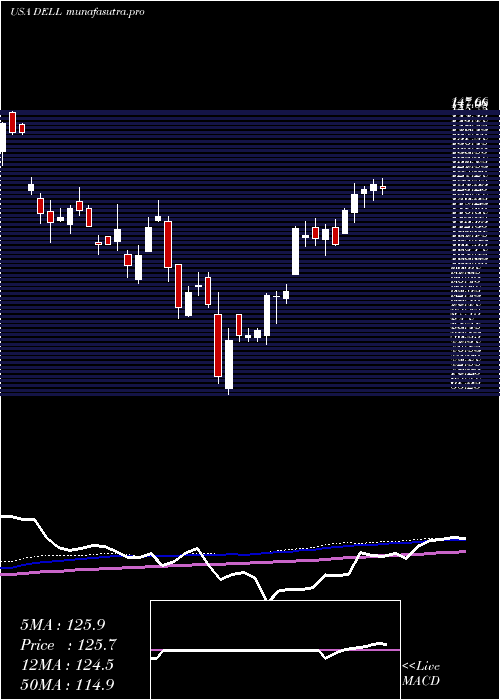
DMA SMA EMA moving averages of Dell Technologies DELL
DMA (daily moving average) of Dell Technologies DELL
| DMA period | DMA value | | 5 day DMA | 150.1 | | 12 day DMA | 151.12 | | 20 day DMA | 145.72 | | 35 day DMA | 137.56 | | 50 day DMA | 136.12 | | 100 day DMA | 129.48 | | 150 day DMA | 117.81 | | 200 day DMA | 115.43 | EMA (exponential moving average) of Dell Technologies DELL
| EMA period | EMA current | EMA prev | EMA prev2 | | 5 day EMA | 149.95 | 151 | 151.56 | | 12 day EMA | 149.04 | 149.26 | 149.15 | | 20 day EMA | 146.12 | 145.94 | 145.52 | | 35 day EMA | 142.15 | 141.81 | 141.33 | | 50 day EMA | 137.3 | 136.87 | 136.34 |
SMA (simple moving average) of Dell Technologies DELL
| SMA period | SMA current | SMA prev | SMA prev2 | | 5 day SMA | 150.1 | 151.21 | 151.35 | | 12 day SMA | 151.12 | 151.08 | 151.07 | | 20 day SMA | 145.72 | 145.11 | 144.21 | | 35 day SMA | 137.56 | 136.82 | 136.03 | | 50 day SMA | 136.12 | 135.93 | 135.68 | | 100 day SMA | 129.48 | 129.15 | 128.77 | | 150 day SMA | 117.81 | 117.44 | 117.07 | | 200 day SMA | 115.43 | 115.27 | 115.1 |
|
|
