EasterlyGovernment DEA full analysis,charts,indicators,moving averages,SMA,DMA,EMA,ADX,MACD,RSIEasterly Government DEA WideScreen charts, DMA,SMA,EMA technical analysis, forecast prediction, by indicators ADX,MACD,RSI,CCI USA stock exchange
operates under Consumer Services sector & deals in Real Estate Investment Trusts
Daily price and charts and targets EasterlyGovernment Strong Daily Stock price targets for EasterlyGovernment DEA are 21.71 and 22.07 | Daily Target 1 | 21.42 | | Daily Target 2 | 21.64 | | Daily Target 3 | 21.78 | | Daily Target 4 | 22 | | Daily Target 5 | 22.14 |
Daily price and volume Easterly Government
| Date |
Closing |
Open |
Range |
Volume |
Thu 04 December 2025 |
21.86 (0.32%) |
21.61 |
21.56 - 21.92 |
1.0342 times |
Wed 03 December 2025 |
21.79 (-0.09%) |
21.86 |
21.63 - 22.03 |
0.988 times |
Tue 02 December 2025 |
21.81 (0.41%) |
21.83 |
21.58 - 21.90 |
0.8185 times |
Mon 01 December 2025 |
21.72 (-0.37%) |
21.62 |
21.62 - 21.98 |
1.0186 times |
Fri 28 November 2025 |
21.80 (-0.37%) |
21.80 |
21.72 - 22.01 |
0.3009 times |
Wed 26 November 2025 |
21.88 (0.46%) |
21.72 |
21.63 - 22.17 |
1.3662 times |
Tue 25 November 2025 |
21.78 (0.23%) |
21.78 |
21.71 - 22.18 |
1.5841 times |
Mon 24 November 2025 |
21.73 (2.07%) |
21.25 |
21.06 - 21.88 |
1.169 times |
Fri 21 November 2025 |
21.29 (3.55%) |
20.58 |
20.57 - 21.43 |
0.8415 times |
Thu 20 November 2025 |
20.56 (-0.87%) |
20.82 |
20.56 - 21.11 |
0.879 times |
Wed 19 November 2025 |
20.74 (-1.29%) |
21.01 |
20.74 - 21.12 |
0.8292 times |
Weekly price and charts EasterlyGovernment Strong weekly Stock price targets for EasterlyGovernment DEA are 21.71 and 22.18 | Weekly Target 1 | 21.35 | | Weekly Target 2 | 21.6 | | Weekly Target 3 | 21.816666666667 | | Weekly Target 4 | 22.07 | | Weekly Target 5 | 22.29 |
Weekly price and volumes for Easterly Government
| Date |
Closing |
Open |
Range |
Volume |
Thu 04 December 2025 |
21.86 (0.28%) |
21.62 |
21.56 - 22.03 |
1.0618 times |
Fri 28 November 2025 |
21.80 (2.4%) |
21.25 |
21.06 - 22.18 |
1.2161 times |
Fri 21 November 2025 |
21.29 (-1.39%) |
21.61 |
20.56 - 21.64 |
1.1674 times |
Fri 14 November 2025 |
21.59 (1.03%) |
21.35 |
21.08 - 22.07 |
1.3487 times |
Fri 07 November 2025 |
21.37 (-1.16%) |
21.37 |
20.71 - 21.61 |
0.6946 times |
Fri 31 October 2025 |
21.62 (0%) |
21.44 |
21.27 - 21.80 |
0.2549 times |
Fri 31 October 2025 |
21.62 (-3.87%) |
22.19 |
21.22 - 22.46 |
1.6706 times |
Fri 24 October 2025 |
22.49 (2.32%) |
22.07 |
21.86 - 22.56 |
0.8065 times |
Fri 17 October 2025 |
21.98 (0.32%) |
21.00 |
20.73 - 22.70 |
1.347 times |
Tue 07 October 2025 |
21.91 (-2.8%) |
22.52 |
21.85 - 22.89 |
0.4324 times |
Fri 03 October 2025 |
22.54 (-1.57%) |
22.90 |
22.39 - 23.00 |
0.988 times |
Monthly price and charts EasterlyGovernment Strong monthly Stock price targets for EasterlyGovernment DEA are 21.71 and 22.18 | Monthly Target 1 | 21.35 | | Monthly Target 2 | 21.6 | | Monthly Target 3 | 21.816666666667 | | Monthly Target 4 | 22.07 | | Monthly Target 5 | 22.29 |
Monthly price and volumes Easterly Government
| Date |
Closing |
Open |
Range |
Volume |
Thu 04 December 2025 |
21.86 (0.28%) |
21.62 |
21.56 - 22.03 |
0.1533 times |
Fri 28 November 2025 |
21.80 (0.83%) |
21.37 |
20.56 - 22.18 |
0.6392 times |
Fri 31 October 2025 |
21.62 (-5.71%) |
22.95 |
20.73 - 23.00 |
0.7244 times |
Tue 30 September 2025 |
22.93 (0.17%) |
22.75 |
22.40 - 23.83 |
0.796 times |
Fri 29 August 2025 |
22.89 (4.05%) |
22.15 |
21.63 - 23.11 |
0.7672 times |
Thu 31 July 2025 |
22.00 (-0.9%) |
21.97 |
21.90 - 23.60 |
0.6884 times |
Mon 30 June 2025 |
22.20 (2.16%) |
21.38 |
21.26 - 23.53 |
0.6984 times |
Fri 30 May 2025 |
21.73 (7.73%) |
20.24 |
19.81 - 22.29 |
0.8134 times |
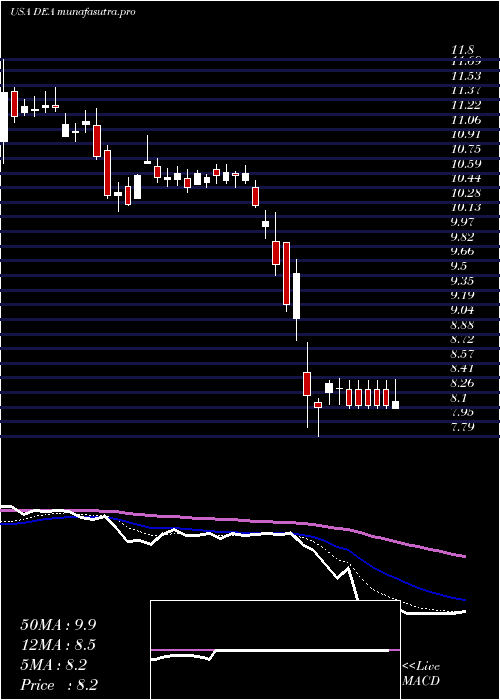
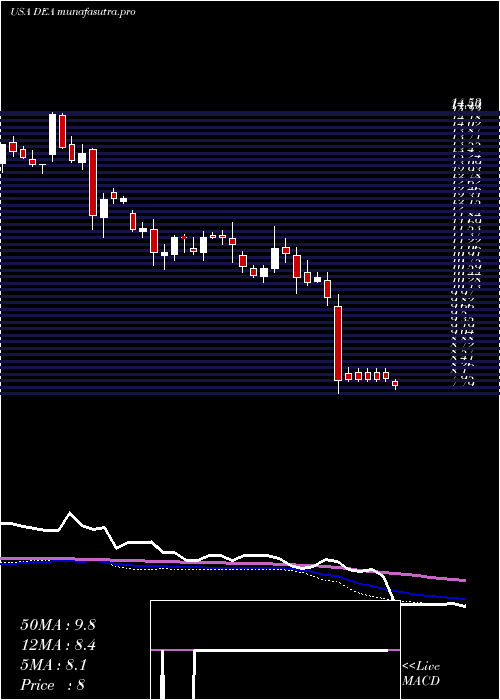
Wed 30 April 2025 |
20.17 (90.28%) |
10.59 |
7.79 - 21.17 |
2.6376 times |
Mon 31 March 2025 |
10.60 (-5.94%) |
11.29 |
10.18 - 11.50 |
2.0821 times |
Fri 28 February 2025 |
11.27 (-0.79%) |
11.11 |
10.45 - 11.80 |
2.2074 times |

DMA SMA EMA moving averages of Easterly Government DEA
DMA (daily moving average) of Easterly Government DEA
| DMA period | DMA value | | 5 day DMA | 21.8 | | 12 day DMA | 21.5 | | 20 day DMA | 21.47 | | 35 day DMA | 21.64 | | 50 day DMA | 21.91 | | 100 day DMA | 22.31 | | 150 day DMA | 22.13 | | 200 day DMA | 19.08 | EMA (exponential moving average) of Easterly Government DEA
| EMA period | EMA current | EMA prev | EMA prev2 | | 5 day EMA | 21.78 | 21.74 | 21.72 | | 12 day EMA | 21.64 | 21.6 | 21.57 | | 20 day EMA | 21.63 | 21.61 | 21.59 | | 35 day EMA | 21.79 | 21.79 | 21.79 | | 50 day EMA | 22 | 22.01 | 22.02 |
SMA (simple moving average) of Easterly Government DEA
| SMA period | SMA current | SMA prev | SMA prev2 | | 5 day SMA | 21.8 | 21.8 | 21.8 | | 12 day SMA | 21.5 | 21.43 | 21.41 | | 20 day SMA | 21.47 | 21.45 | 21.44 | | 35 day SMA | 21.64 | 21.66 | 21.65 | | 50 day SMA | 21.91 | 21.93 | 21.96 | | 100 day SMA | 22.31 | 22.32 | 22.33 | | 150 day SMA | 22.13 | 22.04 | 21.95 | | 200 day SMA | 19.08 | 19.03 | 18.97 |
|
|
