DeereCompany DE full analysis,charts,indicators,moving averages,SMA,DMA,EMA,ADX,MACD,RSIDeere Company DE WideScreen charts, DMA,SMA,EMA technical analysis, forecast prediction, by indicators ADX,MACD,RSI,CCI USA stock exchange
operates under Capital Goods sector & deals in Industrial Machinery Components
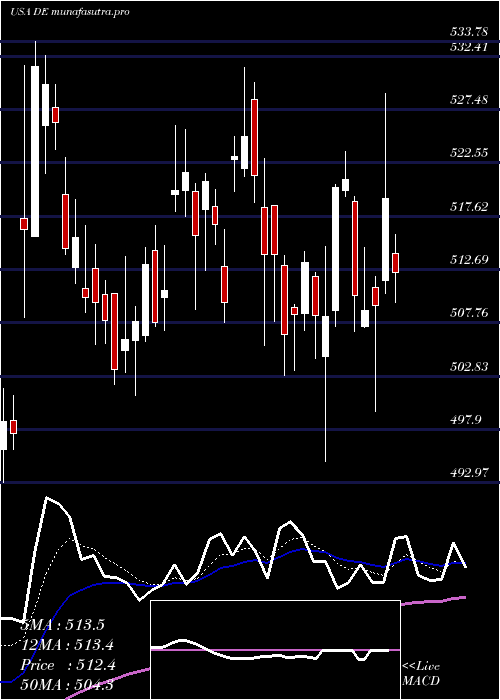
Daily price and charts and targets DeereCompany Strong Daily Stock price targets for DeereCompany DE are 479.12 and 487.41 | Daily Target 1 | 472.29 | | Daily Target 2 | 477.66 | | Daily Target 3 | 480.58 | | Daily Target 4 | 485.95 | | Daily Target 5 | 488.87 |
Daily price and volume Deere Company
| Date |
Closing |
Open |
Range |
Volume |
Thu 04 December 2025 |
483.03 (0.25%) |
480.99 |
475.21 - 483.50 |
0.7623 times |
Wed 03 December 2025 |
481.82 (2.7%) |
471.00 |
468.56 - 482.45 |
0.6397 times |
Tue 02 December 2025 |
469.15 (0.22%) |
471.72 |
466.43 - 473.77 |
0.7202 times |
Mon 01 December 2025 |
468.11 (0.78%) |
463.72 |
461.41 - 474.50 |
1.0077 times |
Fri 28 November 2025 |
464.49 (-1.05%) |
466.91 |
463.01 - 473.67 |
0.9296 times |
Wed 26 November 2025 |
469.42 (-5.81%) |
499.35 |
466.50 - 505.00 |
2.1553 times |
Tue 25 November 2025 |
498.38 (2.29%) |
485.86 |
485.52 - 500.52 |
0.7123 times |
Mon 24 November 2025 |
487.23 (-0%) |
488.62 |
484.10 - 494.31 |
1.206 times |
Fri 21 November 2025 |
487.24 (2.29%) |
477.64 |
476.51 - 491.04 |
1.0143 times |
Thu 20 November 2025 |
476.33 (0.33%) |
478.00 |
473.71 - 484.21 |
0.8526 times |
Wed 19 November 2025 |
474.77 (0.19%) |
474.36 |
468.16 - 476.40 |
0.6642 times |
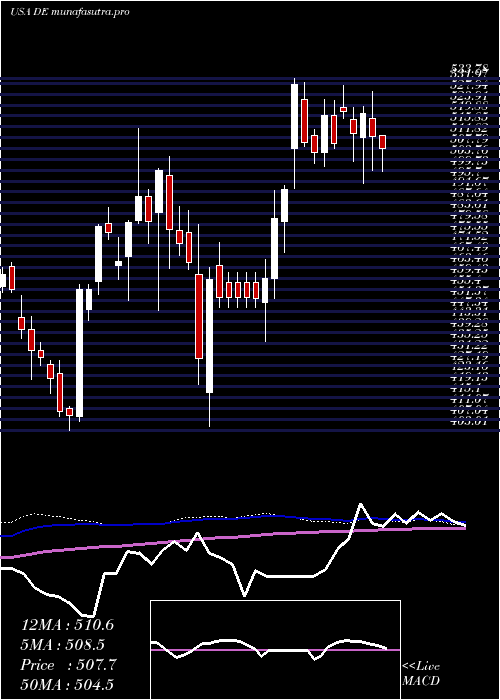
Weekly price and charts DeereCompany Strong weekly Stock price targets for DeereCompany DE are 472.22 and 494.31 | Weekly Target 1 | 453.89 | | Weekly Target 2 | 468.46 | | Weekly Target 3 | 475.98 | | Weekly Target 4 | 490.55 | | Weekly Target 5 | 498.07 |
Weekly price and volumes for Deere Company
| Date |
Closing |
Open |
Range |
Volume |
Thu 04 December 2025 |
483.03 (3.99%) |
463.72 |
461.41 - 483.50 |
1.0244 times |
Fri 28 November 2025 |
464.49 (-4.67%) |
488.62 |
463.01 - 505.00 |
1.6374 times |
Fri 21 November 2025 |
487.24 (2.31%) |
475.27 |
468.16 - 491.04 |
1.2688 times |
Fri 14 November 2025 |
476.23 (1.8%) |
468.90 |
463.68 - 484.93 |
0.8708 times |
Fri 07 November 2025 |
467.79 (1.33%) |
457.29 |
456.00 - 481.28 |
0.9348 times |
Fri 31 October 2025 |
461.63 (0%) |
463.57 |
458.72 - 464.54 |
0.2019 times |
Fri 31 October 2025 |
461.63 (-2.35%) |
480.56 |
458.72 - 483.00 |
1.0169 times |
Fri 24 October 2025 |
472.76 (3.11%) |
457.61 |
455.89 - 477.60 |
0.8597 times |
Fri 17 October 2025 |
458.50 (2.72%) |
449.37 |
433.00 - 465.70 |
1.2201 times |
Fri 10 October 2025 |
446.35 (-3.57%) |
463.75 |
441.89 - 466.63 |
0.9652 times |
Fri 03 October 2025 |
462.88 (-0.24%) |
465.83 |
447.44 - 469.24 |
1.2648 times |
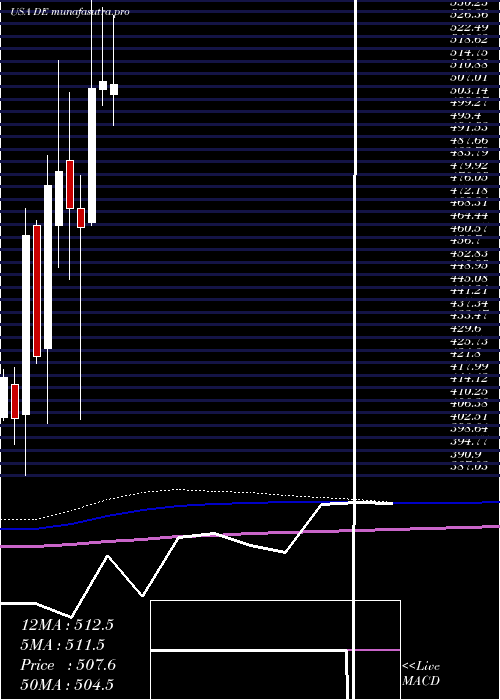
Monthly price and charts DeereCompany Strong monthly Stock price targets for DeereCompany DE are 472.22 and 494.31 | Monthly Target 1 | 453.89 | | Monthly Target 2 | 468.46 | | Monthly Target 3 | 475.98 | | Monthly Target 4 | 490.55 | | Monthly Target 5 | 498.07 |
Monthly price and volumes Deere Company
| Date |
Closing |
Open |
Range |
Volume |
Thu 04 December 2025 |
483.03 (3.99%) |
463.72 |
461.41 - 483.50 |
0.224 times |
Fri 28 November 2025 |
464.49 (0.62%) |
457.29 |
456.00 - 505.00 |
1.0302 times |
Fri 31 October 2025 |
461.63 (0.96%) |
455.00 |
433.00 - 483.00 |
1.0898 times |
Tue 30 September 2025 |
457.26 (-4.47%) |
472.92 |
453.68 - 483.38 |
1.2431 times |
Fri 29 August 2025 |
478.64 (-8.72%) |
519.00 |
470.49 - 520.17 |
1.2299 times |
Thu 31 July 2025 |
524.37 (3.12%) |
504.68 |
492.06 - 528.98 |
0.9639 times |
Mon 30 June 2025 |
508.49 (0.44%) |
506.16 |
501.02 - 531.38 |
0.8725 times |
Fri 30 May 2025 |
506.26 (9.21%) |
465.00 |
464.25 - 533.78 |
1.1082 times |
Wed 30 April 2025 |
463.56 (-1.23%) |
469.36 |
404.42 - 479.55 |
1.1716 times |
Mon 31 March 2025 |
469.35 (-2.38%) |
484.07 |
447.65 - 504.98 |
1.067 times |
Fri 28 February 2025 |
480.79 (0.89%) |
464.15 |
451.22 - 515.05 |
1.1668 times |
DMA SMA EMA moving averages of Deere Company DE
DMA (daily moving average) of Deere Company DE
| DMA period | DMA value | | 5 day DMA | 473.32 | | 12 day DMA | 477.82 | | 20 day DMA | 476.79 | | 35 day DMA | 472.25 | | 50 day DMA | 467.53 | | 100 day DMA | 479.23 | | 150 day DMA | 489.07 | | 200 day DMA | 483.35 | EMA (exponential moving average) of Deere Company DE
| EMA period | EMA current | EMA prev | EMA prev2 | | 5 day EMA | 477.8 | 475.19 | 471.87 | | 12 day EMA | 476.82 | 475.69 | 474.57 | | 20 day EMA | 475.57 | 474.78 | 474.04 | | 35 day EMA | 472.48 | 471.86 | 471.27 | | 50 day EMA | 468.47 | 467.88 | 467.31 |
SMA (simple moving average) of Deere Company DE
| SMA period | SMA current | SMA prev | SMA prev2 | | 5 day SMA | 473.32 | 470.6 | 473.91 | | 12 day SMA | 477.82 | 477.23 | 476.77 | | 20 day SMA | 476.79 | 476.32 | 475.65 | | 35 day SMA | 472.25 | 471.26 | 470.3 | | 50 day SMA | 467.53 | 467.24 | 467.04 | | 100 day SMA | 479.23 | 479.44 | 479.7 | | 150 day SMA | 489.07 | 488.94 | 488.8 | | 200 day SMA | 483.35 | 483.48 | 483.58 |
|
|
