DimeCommunity DCOM full analysis,charts,indicators,moving averages,SMA,DMA,EMA,ADX,MACD,RSIDime Community DCOM WideScreen charts, DMA,SMA,EMA technical analysis, forecast prediction, by indicators ADX,MACD,RSI,CCI USA stock exchange
operates under Finance sector & deals in Savings Institutions
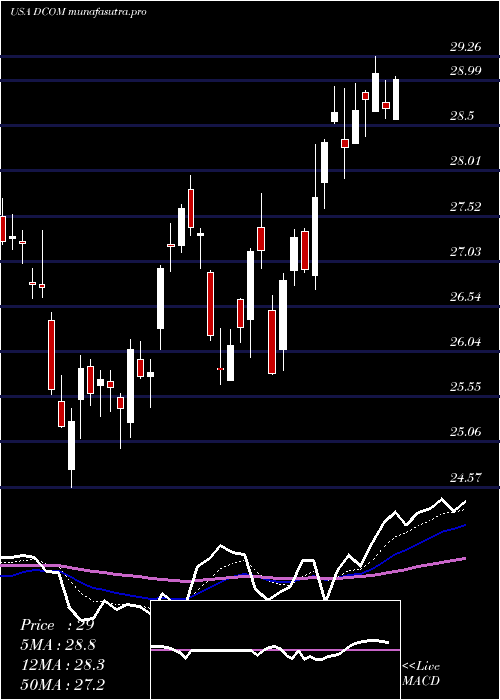
Daily price and charts and targets DimeCommunity Strong Daily Stock price targets for DimeCommunity DCOM are 28.01 and 29.83 | Daily Target 1 | 26.51 | | Daily Target 2 | 27.68 | | Daily Target 3 | 28.33 | | Daily Target 4 | 29.5 | | Daily Target 5 | 30.15 |
Daily price and volume Dime Community
| Date |
Closing |
Open |
Range |
Volume |
Mon 20 October 2025 |
28.85 (3.7%) |
28.03 |
27.16 - 28.98 |
0.9762 times |
Fri 17 October 2025 |
27.82 (-0.22%) |
27.94 |
27.74 - 28.21 |
1.0951 times |
Thu 16 October 2025 |
27.88 (-6.66%) |
29.76 |
27.58 - 30.55 |
2.2132 times |
Wed 15 October 2025 |
29.87 (-1.52%) |
30.44 |
29.71 - 30.56 |
0.8011 times |
Tue 14 October 2025 |
30.33 (3.62%) |
28.92 |
28.92 - 30.46 |
0.9642 times |
Mon 13 October 2025 |
29.27 (0.93%) |
29.45 |
28.97 - 29.45 |
0.6277 times |
Fri 10 October 2025 |
29.00 (-3.24%) |
30.07 |
28.94 - 30.65 |
1.1709 times |
Thu 09 October 2025 |
29.97 (-1.25%) |
30.23 |
29.70 - 30.48 |
0.5214 times |
Wed 08 October 2025 |
30.35 (-0.26%) |
30.62 |
30.22 - 30.82 |
0.8304 times |
Tue 07 October 2025 |
30.43 (-0.69%) |
30.66 |
30.40 - 31.13 |
0.7999 times |
Mon 06 October 2025 |
30.64 (1.26%) |
30.59 |
30.35 - 31.23 |
1.1181 times |
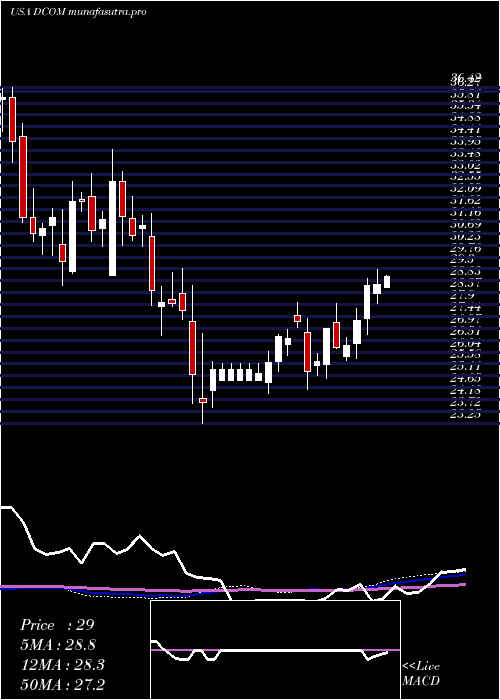
Weekly price and charts DimeCommunity Strong weekly Stock price targets for DimeCommunity DCOM are 28.01 and 29.83 | Weekly Target 1 | 26.51 | | Weekly Target 2 | 27.68 | | Weekly Target 3 | 28.33 | | Weekly Target 4 | 29.5 | | Weekly Target 5 | 30.15 |
Weekly price and volumes for Dime Community
| Date |
Closing |
Open |
Range |
Volume |
Mon 20 October 2025 |
28.85 (3.7%) |
28.03 |
27.16 - 28.98 |
0.2302 times |
Fri 17 October 2025 |
27.82 (-4.07%) |
29.45 |
27.58 - 30.56 |
1.3442 times |
Fri 10 October 2025 |
29.00 (-4.16%) |
30.59 |
28.94 - 31.23 |
1.047 times |
Fri 03 October 2025 |
30.26 (-0.49%) |
30.51 |
29.35 - 30.60 |
1.1516 times |
Fri 26 September 2025 |
30.41 (-1.65%) |
30.84 |
29.94 - 31.44 |
1.1972 times |
Fri 19 September 2025 |
30.92 (0.36%) |
30.95 |
30.20 - 31.82 |
1.8736 times |
Fri 12 September 2025 |
30.81 (0.59%) |
30.75 |
30.18 - 31.07 |
1.166 times |
Fri 05 September 2025 |
30.63 (-0.42%) |
30.42 |
30.12 - 31.33 |
0.8072 times |
Fri 29 August 2025 |
30.76 (0%) |
30.90 |
30.58 - 31.04 |
0.153 times |
Fri 29 August 2025 |
30.76 (2.16%) |
30.87 |
29.93 - 31.08 |
1.0301 times |
Fri 22 August 2025 |
30.11 (5.13%) |
28.54 |
27.85 - 30.14 |
1.2279 times |
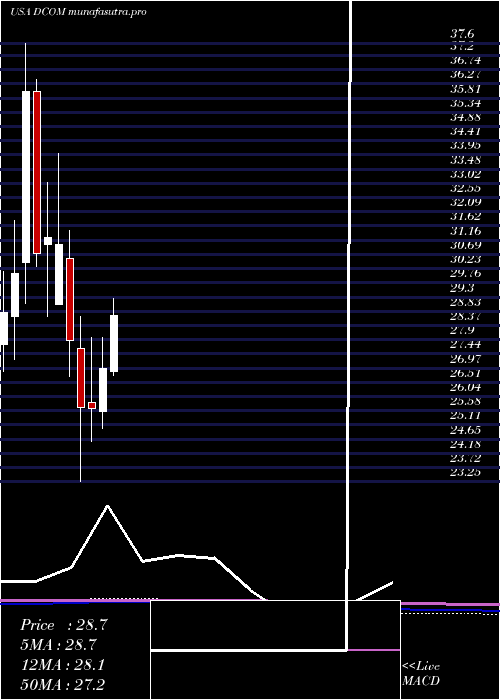
Monthly price and charts DimeCommunity Strong monthly Stock price targets for DimeCommunity DCOM are 25.97 and 30.04 | Monthly Target 1 | 25.01 | | Monthly Target 2 | 26.93 | | Monthly Target 3 | 29.08 | | Monthly Target 4 | 31 | | Monthly Target 5 | 33.15 |
Monthly price and volumes Dime Community
| Date |
Closing |
Open |
Range |
Volume |
Mon 20 October 2025 |
28.85 (-3.29%) |
29.54 |
27.16 - 31.23 |
0.4799 times |
Tue 30 September 2025 |
29.83 (-3.02%) |
30.42 |
29.35 - 31.82 |
0.7906 times |
Fri 29 August 2025 |
30.76 (11.01%) |
27.27 |
26.66 - 31.08 |
0.7731 times |
Thu 31 July 2025 |
27.71 (2.86%) |
26.87 |
26.72 - 29.52 |
1.1855 times |
Mon 30 June 2025 |
26.94 (4.99%) |
25.55 |
24.99 - 27.96 |
1.1138 times |
Fri 30 May 2025 |
25.66 (-0.12%) |
25.84 |
24.57 - 27.98 |
0.7796 times |
Wed 30 April 2025 |
25.69 (-7.86%) |
27.61 |
23.25 - 28.66 |
1.4203 times |
Mon 31 March 2025 |
27.88 (-10.06%) |
30.55 |
26.69 - 31.48 |
1.03 times |
Fri 28 February 2025 |
31.00 (-0.74%) |
29.05 |
29.05 - 34.00 |
0.9472 times |
Fri 31 January 2025 |
31.23 (1.63%) |
31.03 |
28.65 - 33.05 |
1.48 times |
Tue 31 December 2024 |
30.73 (-14.66%) |
36.03 |
30.28 - 36.42 |
1.098 times |
DMA SMA EMA moving averages of Dime Community DCOM
DMA (daily moving average) of Dime Community DCOM
| DMA period | DMA value | | 5 day DMA | 28.95 | | 12 day DMA | 29.56 | | 20 day DMA | 29.77 | | 35 day DMA | 30.21 | | 50 day DMA | 30.04 | | 100 day DMA | 28.76 | | 150 day DMA | 27.92 | | 200 day DMA | 28.61 | EMA (exponential moving average) of Dime Community DCOM
| EMA period | EMA current | EMA prev | EMA prev2 | | 5 day EMA | 28.78 | 28.74 | 29.2 | | 12 day EMA | 29.31 | 29.39 | 29.67 | | 20 day EMA | 29.59 | 29.67 | 29.86 | | 35 day EMA | 29.67 | 29.72 | 29.83 | | 50 day EMA | 29.71 | 29.75 | 29.83 |
SMA (simple moving average) of Dime Community DCOM
| SMA period | SMA current | SMA prev | SMA prev2 | | 5 day SMA | 28.95 | 29.03 | 29.27 | | 12 day SMA | 29.56 | 29.63 | 29.8 | | 20 day SMA | 29.77 | 29.88 | 30.03 | | 35 day SMA | 30.21 | 30.26 | 30.35 | | 50 day SMA | 30.04 | 30.02 | 30.01 | | 100 day SMA | 28.76 | 28.73 | 28.7 | | 150 day SMA | 27.92 | 27.91 | 27.92 | | 200 day SMA | 28.61 | 28.62 | 28.64 |
|
|
