EndavaPlc DAVA full analysis,charts,indicators,moving averages,SMA,DMA,EMA,ADX,MACD,RSIEndava Plc DAVA WideScreen charts, DMA,SMA,EMA technical analysis, forecast prediction, by indicators ADX,MACD,RSI,CCI USA stock exchange
operates under Technology sector & deals in EDP Services
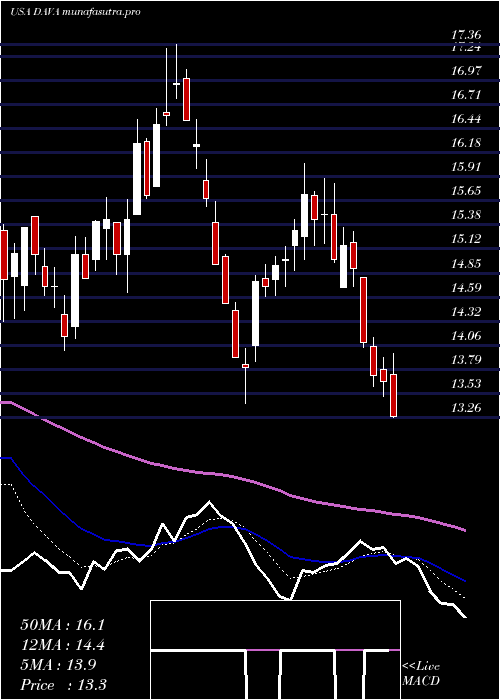
Daily price and charts and targets EndavaPlc Strong Daily Stock price targets for EndavaPlc DAVA are 6.39 and 6.73 | Daily Target 1 | 6.13 | | Daily Target 2 | 6.3 | | Daily Target 3 | 6.4666666666667 | | Daily Target 4 | 6.64 | | Daily Target 5 | 6.81 |
Daily price and volume Endava Plc
| Date |
Closing |
Open |
Range |
Volume |
Thu 04 December 2025 |
6.48 (2.69%) |
6.36 |
6.29 - 6.63 |
1.4156 times |
Wed 03 December 2025 |
6.31 (4.3%) |
6.10 |
6.06 - 6.38 |
1.3259 times |
Tue 02 December 2025 |
6.05 (-3.2%) |
6.20 |
6.02 - 6.31 |
0.8661 times |
Mon 01 December 2025 |
6.25 (-3.25%) |
6.40 |
6.25 - 6.45 |
0.8264 times |
Fri 28 November 2025 |
6.46 (1.89%) |
6.36 |
6.31 - 6.54 |
0.686 times |
Wed 26 November 2025 |
6.34 (-0.16%) |
6.29 |
6.24 - 6.41 |
0.6762 times |
Tue 25 November 2025 |
6.35 (0.79%) |
6.28 |
6.27 - 6.45 |
1.1417 times |
Mon 24 November 2025 |
6.30 (0%) |
6.40 |
6.17 - 6.41 |
0.5726 times |
Fri 21 November 2025 |
6.30 (3.11%) |
6.08 |
6.05 - 6.41 |
1.2805 times |
Thu 20 November 2025 |
6.11 (-0.33%) |
6.21 |
6.03 - 6.22 |
1.2091 times |
Wed 19 November 2025 |
6.13 (-1.45%) |
6.25 |
6.10 - 6.28 |
1.0205 times |
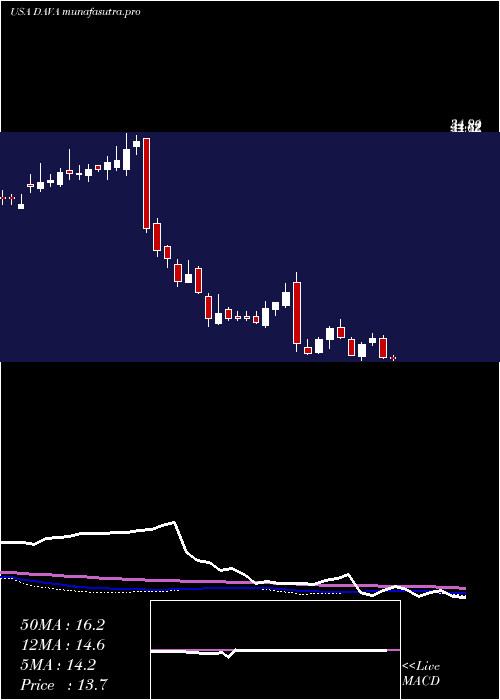
Weekly price and charts EndavaPlc Strong weekly Stock price targets for EndavaPlc DAVA are 6.25 and 6.86 | Weekly Target 1 | 5.77 | | Weekly Target 2 | 6.12 | | Weekly Target 3 | 6.3766666666667 | | Weekly Target 4 | 6.73 | | Weekly Target 5 | 6.99 |
Weekly price and volumes for Endava Plc
| Date |
Closing |
Open |
Range |
Volume |
Thu 04 December 2025 |
6.48 (0.31%) |
6.40 |
6.02 - 6.63 |
0.9516 times |
Fri 28 November 2025 |
6.46 (2.54%) |
6.40 |
6.17 - 6.54 |
0.6603 times |
Fri 21 November 2025 |
6.30 (-3.96%) |
6.59 |
6.03 - 6.63 |
1.2754 times |
Fri 14 November 2025 |
6.56 (-29.46%) |
9.44 |
6.52 - 9.47 |
2.7319 times |
Fri 07 November 2025 |
9.30 (0.32%) |
8.60 |
8.45 - 9.39 |
0.5611 times |
Fri 31 October 2025 |
9.27 (0%) |
9.30 |
9.08 - 9.40 |
0.1684 times |
Fri 31 October 2025 |
9.27 (-2.01%) |
9.61 |
9.08 - 9.88 |
0.9225 times |
Fri 24 October 2025 |
9.46 (11.82%) |
8.60 |
8.50 - 9.50 |
0.9131 times |
Fri 17 October 2025 |
8.46 (-8.93%) |
9.27 |
8.22 - 9.45 |
0.8125 times |
Fri 03 October 2025 |
9.29 (4.5%) |
8.99 |
8.87 - 9.64 |
1.0031 times |
Fri 26 September 2025 |
8.89 (-3.68%) |
9.14 |
8.70 - 9.49 |
1.5264 times |
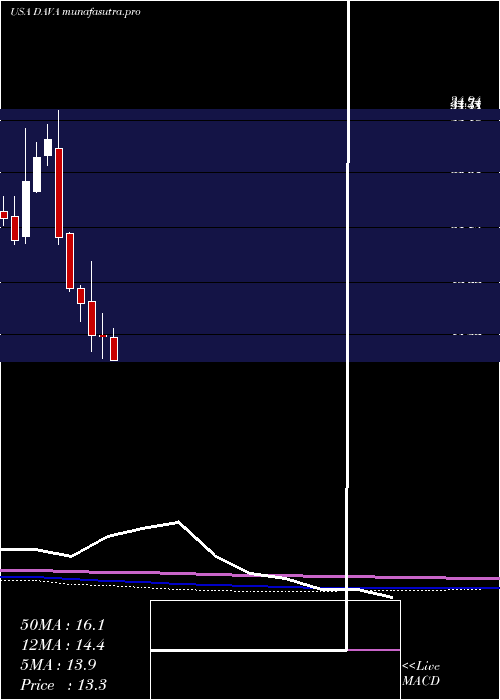
Monthly price and charts EndavaPlc Strong monthly Stock price targets for EndavaPlc DAVA are 6.25 and 6.86 | Monthly Target 1 | 5.77 | | Monthly Target 2 | 6.12 | | Monthly Target 3 | 6.3766666666667 | | Monthly Target 4 | 6.73 | | Monthly Target 5 | 6.99 |
Monthly price and volumes Endava Plc
| Date |
Closing |
Open |
Range |
Volume |
Thu 04 December 2025 |
6.48 (0.31%) |
6.40 |
6.02 - 6.63 |
0.2544 times |
Fri 28 November 2025 |
6.46 (-30.31%) |
8.60 |
6.03 - 9.47 |
1.3978 times |
Fri 31 October 2025 |
9.27 (1.87%) |
9.01 |
8.22 - 9.88 |
0.9129 times |
Tue 30 September 2025 |
9.10 (-38.01%) |
14.30 |
8.70 - 14.61 |
2.1557 times |
Fri 29 August 2025 |
14.68 (14.69%) |
12.52 |
11.63 - 14.99 |
0.9821 times |
Thu 31 July 2025 |
12.80 (-16.45%) |
15.25 |
12.76 - 16.05 |
0.7831 times |
Mon 30 June 2025 |
15.32 (-0.78%) |
15.41 |
13.42 - 17.36 |
0.9029 times |
Fri 30 May 2025 |
15.44 (-15.21%) |
18.40 |
14.00 - 21.81 |
1.536 times |
Wed 30 April 2025 |
18.21 (-6.66%) |
19.52 |
16.60 - 19.79 |
0.5366 times |
Mon 31 March 2025 |
19.51 (-18.44%) |
24.26 |
19.28 - 24.40 |
0.5385 times |
Fri 28 February 2025 |
23.92 (-26.22%) |
31.61 |
23.28 - 34.94 |
0.5577 times |
DMA SMA EMA moving averages of Endava Plc DAVA
DMA (daily moving average) of Endava Plc DAVA
| DMA period | DMA value | | 5 day DMA | 6.31 | | 12 day DMA | 6.28 | | 20 day DMA | 6.85 | | 35 day DMA | 7.78 | | 50 day DMA | 8.19 | | 100 day DMA | 10.5 | | 150 day DMA | 12.46 | | 200 day DMA | 14.9 | EMA (exponential moving average) of Endava Plc DAVA
| EMA period | EMA current | EMA prev | EMA prev2 | | 5 day EMA | 6.33 | 6.26 | 6.24 | | 12 day EMA | 6.51 | 6.51 | 6.55 | | 20 day EMA | 6.88 | 6.92 | 6.98 | | 35 day EMA | 7.44 | 7.5 | 7.57 | | 50 day EMA | 8.12 | 8.19 | 8.27 |
SMA (simple moving average) of Endava Plc DAVA
| SMA period | SMA current | SMA prev | SMA prev2 | | 5 day SMA | 6.31 | 6.28 | 6.29 | | 12 day SMA | 6.28 | 6.26 | 6.28 | | 20 day SMA | 6.85 | 6.97 | 7.08 | | 35 day SMA | 7.78 | 7.84 | 7.92 | | 50 day SMA | 8.19 | 8.25 | 8.32 | | 100 day SMA | 10.5 | 10.59 | 10.67 | | 150 day SMA | 12.46 | 12.53 | 12.6 | | 200 day SMA | 14.9 | 15.03 | 15.17 |
|
|
