CemexS CX full analysis,charts,indicators,moving averages,SMA,DMA,EMA,ADX,MACD,RSICemex S CX WideScreen charts, DMA,SMA,EMA technical analysis, forecast prediction, by indicators ADX,MACD,RSI,CCI USA stock exchange
operates under Capital Goods sector & deals in Building Materials
Daily price and charts and targets CemexS Strong Daily Stock price targets for CemexS CX are 10.93 and 11.08 | Daily Target 1 | 10.8 | | Daily Target 2 | 10.9 | | Daily Target 3 | 10.953333333333 | | Daily Target 4 | 11.05 | | Daily Target 5 | 11.1 |
Daily price and volume Cemex S
| Date |
Closing |
Open |
Range |
Volume |
Thu 04 December 2025 |
10.99 (1.01%) |
10.88 |
10.86 - 11.01 |
0.62 times |
Wed 03 December 2025 |
10.88 (1.21%) |
10.76 |
10.68 - 10.92 |
0.5714 times |
Tue 02 December 2025 |
10.75 (1.42%) |
10.63 |
10.61 - 10.84 |
1.3219 times |
Mon 01 December 2025 |
10.60 (-1.76%) |
10.73 |
10.58 - 10.79 |
0.9137 times |
Fri 28 November 2025 |
10.79 (2.08%) |
10.60 |
10.45 - 10.84 |
0.9222 times |
Wed 26 November 2025 |
10.57 (1.44%) |
10.45 |
10.40 - 10.59 |
0.8838 times |
Tue 25 November 2025 |
10.42 (3.48%) |
10.17 |
10.10 - 10.48 |
1.2865 times |
Mon 24 November 2025 |
10.07 (0.4%) |
10.01 |
10.00 - 10.24 |
1.2918 times |
Fri 21 November 2025 |
10.03 (-1.38%) |
10.20 |
10.01 - 10.27 |
1.3193 times |
Thu 20 November 2025 |
10.17 (-1.55%) |
10.44 |
10.16 - 10.55 |
0.8694 times |
Wed 19 November 2025 |
10.33 (1.18%) |
10.25 |
10.20 - 10.42 |
0.5137 times |
Weekly price and charts CemexS Strong weekly Stock price targets for CemexS CX are 10.79 and 11.22 | Weekly Target 1 | 10.43 | | Weekly Target 2 | 10.71 | | Weekly Target 3 | 10.86 | | Weekly Target 4 | 11.14 | | Weekly Target 5 | 11.29 |
Weekly price and volumes for Cemex S
| Date |
Closing |
Open |
Range |
Volume |
Thu 04 December 2025 |
10.99 (1.85%) |
10.73 |
10.58 - 11.01 |
0.6637 times |
Fri 28 November 2025 |
10.79 (7.58%) |
10.01 |
10.00 - 10.84 |
0.8491 times |
Fri 21 November 2025 |
10.03 (-0.79%) |
10.15 |
9.94 - 10.55 |
1.0188 times |
Fri 14 November 2025 |
10.11 (-0.88%) |
10.27 |
10.01 - 10.56 |
0.8917 times |
Fri 07 November 2025 |
10.20 (0.49%) |
10.17 |
9.90 - 10.41 |
1.0211 times |
Fri 31 October 2025 |
10.15 (0%) |
10.11 |
10.11 - 10.24 |
0.1713 times |
Fri 31 October 2025 |
10.15 (8.44%) |
9.47 |
9.30 - 10.45 |
1.5897 times |
Fri 24 October 2025 |
9.36 (-3.01%) |
9.64 |
9.11 - 9.75 |
1.2348 times |
Fri 17 October 2025 |
9.65 (5.46%) |
9.11 |
9.11 - 9.97 |
1.7324 times |
Fri 10 October 2025 |
9.15 (0.88%) |
9.19 |
8.96 - 9.31 |
0.8275 times |
Fri 03 October 2025 |
9.07 (0.78%) |
9.08 |
8.73 - 9.20 |
0.9616 times |
Monthly price and charts CemexS Strong monthly Stock price targets for CemexS CX are 10.79 and 11.22 | Monthly Target 1 | 10.43 | | Monthly Target 2 | 10.71 | | Monthly Target 3 | 10.86 | | Monthly Target 4 | 11.14 | | Monthly Target 5 | 11.29 |
Monthly price and volumes Cemex S
| Date |
Closing |
Open |
Range |
Volume |
Thu 04 December 2025 |
10.99 (1.85%) |
10.73 |
10.58 - 11.01 |
0.1144 times |
Fri 28 November 2025 |
10.79 (6.31%) |
10.17 |
9.90 - 10.84 |
0.6517 times |
Fri 31 October 2025 |
10.15 (12.9%) |
9.02 |
8.73 - 10.45 |
1.0603 times |
Tue 30 September 2025 |
8.99 (-1.1%) |
8.92 |
8.86 - 9.61 |
0.8467 times |
Fri 29 August 2025 |
9.09 (4.48%) |
8.66 |
8.18 - 9.19 |
1.1366 times |
Thu 31 July 2025 |
8.70 (25.54%) |
6.89 |
6.88 - 8.79 |
1.1979 times |
Mon 30 June 2025 |
6.93 (1.17%) |
6.86 |
6.63 - 7.24 |
1.0186 times |
Fri 30 May 2025 |
6.85 (11.02%) |
6.21 |
5.94 - 7.34 |
1.3629 times |
Wed 30 April 2025 |
6.17 (9.98%) |
5.64 |
4.89 - 6.26 |
1.6741 times |
Mon 31 March 2025 |
5.61 (-9.52%) |
6.27 |
5.41 - 6.42 |
0.9369 times |
Fri 28 February 2025 |
6.20 (4.55%) |
5.75 |
5.60 - 6.84 |
0.7815 times |
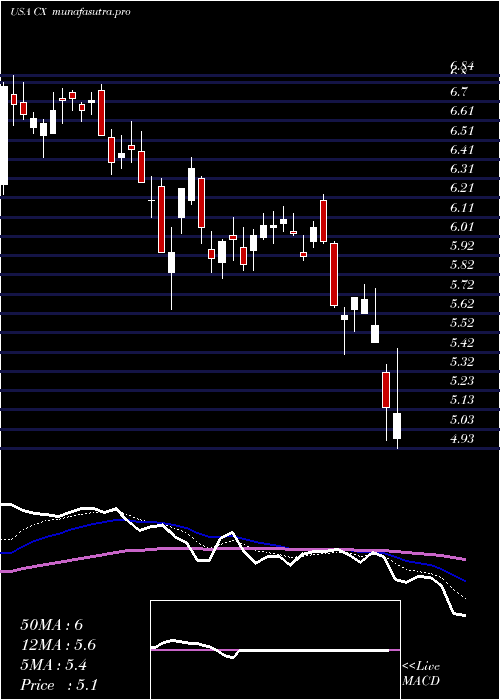
DMA SMA EMA moving averages of Cemex S CX
DMA (daily moving average) of Cemex S CX
| DMA period | DMA value | | 5 day DMA | 10.8 | | 12 day DMA | 10.48 | | 20 day DMA | 10.39 | | 35 day DMA | 10.12 | | 50 day DMA | 9.84 | | 100 day DMA | 9.3 | | 150 day DMA | 8.49 | | 200 day DMA | 7.82 | EMA (exponential moving average) of Cemex S CX
| EMA period | EMA current | EMA prev | EMA prev2 | | 5 day EMA | 10.79 | 10.69 | 10.6 | | 12 day EMA | 10.57 | 10.49 | 10.42 | | 20 day EMA | 10.41 | 10.35 | 10.29 | | 35 day EMA | 10.12 | 10.07 | 10.02 | | 50 day EMA | 9.87 | 9.82 | 9.78 |
SMA (simple moving average) of Cemex S CX
| SMA period | SMA current | SMA prev | SMA prev2 | | 5 day SMA | 10.8 | 10.72 | 10.63 | | 12 day SMA | 10.48 | 10.4 | 10.34 | | 20 day SMA | 10.39 | 10.35 | 10.31 | | 35 day SMA | 10.12 | 10.09 | 10.05 | | 50 day SMA | 9.84 | 9.8 | 9.76 | | 100 day SMA | 9.3 | 9.27 | 9.23 | | 150 day SMA | 8.49 | 8.46 | 8.43 | | 200 day SMA | 7.82 | 7.8 | 7.78 |
|
|
