CurtissWright CW full analysis,charts,indicators,moving averages,SMA,DMA,EMA,ADX,MACD,RSICurtiss Wright CW WideScreen charts, DMA,SMA,EMA technical analysis, forecast prediction, by indicators ADX,MACD,RSI,CCI USA stock exchange
operates under Technology sector & deals in Industrial Machinery Components
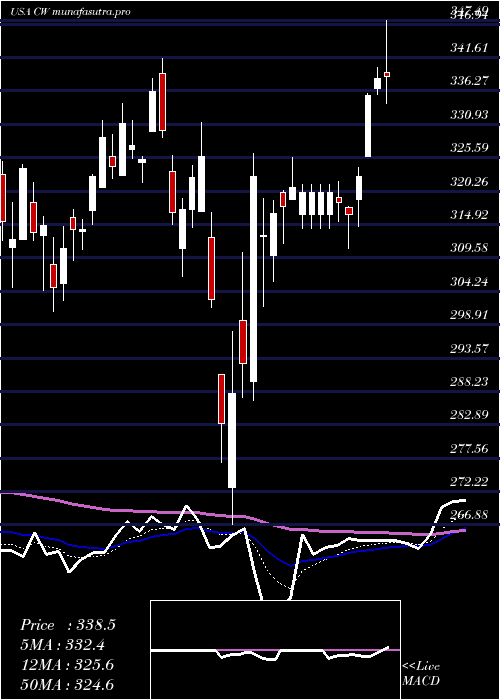
Daily price and charts and targets CurtissWright Strong Daily Stock price targets for CurtissWright CW are 542.79 and 564.11 | Daily Target 1 | 526.16 | | Daily Target 2 | 538.1 | | Daily Target 3 | 547.48333333333 | | Daily Target 4 | 559.42 | | Daily Target 5 | 568.8 |
Daily price and volume Curtiss Wright
| Date |
Closing |
Open |
Range |
Volume |
Thu 04 December 2025 |
550.03 (2.64%) |
535.55 |
535.55 - 556.87 |
0.9588 times |
Wed 03 December 2025 |
535.89 (-2.1%) |
546.51 |
528.92 - 547.38 |
1.4021 times |
Tue 02 December 2025 |
547.36 (0.24%) |
551.63 |
542.77 - 552.63 |
0.8755 times |
Mon 01 December 2025 |
546.05 (-3.23%) |
557.83 |
544.63 - 560.41 |
1.0113 times |
Fri 28 November 2025 |
564.29 (0.24%) |
566.03 |
557.56 - 567.13 |
0.6126 times |
Wed 26 November 2025 |
562.96 (1.38%) |
560.00 |
557.61 - 574.10 |
1.2813 times |
Tue 25 November 2025 |
555.28 (1.63%) |
546.97 |
538.00 - 556.49 |
0.7886 times |
Mon 24 November 2025 |
546.35 (1.93%) |
537.50 |
534.74 - 547.53 |
0.9809 times |
Fri 21 November 2025 |
536.00 (0.04%) |
534.59 |
521.66 - 539.74 |
1.0277 times |
Thu 20 November 2025 |
535.80 (-2.22%) |
561.45 |
531.39 - 575.33 |
1.0612 times |
Wed 19 November 2025 |
547.95 (2.08%) |
539.91 |
536.15 - 550.05 |
0.8808 times |
Weekly price and charts CurtissWright Strong weekly Stock price targets for CurtissWright CW are 523.73 and 555.22 | Weekly Target 1 | 514.96 | | Weekly Target 2 | 532.5 | | Weekly Target 3 | 546.45333333333 | | Weekly Target 4 | 563.99 | | Weekly Target 5 | 577.94 |
Weekly price and volumes for Curtiss Wright
| Date |
Closing |
Open |
Range |
Volume |
Thu 04 December 2025 |
550.03 (-2.53%) |
557.83 |
528.92 - 560.41 |
0.9042 times |
Fri 28 November 2025 |
564.29 (5.28%) |
537.50 |
534.74 - 574.10 |
0.7798 times |
Fri 21 November 2025 |
536.00 (-2.82%) |
553.13 |
521.66 - 575.33 |
1.0619 times |
Fri 14 November 2025 |
551.56 (-4.67%) |
589.18 |
525.15 - 596.20 |
1.0887 times |
Fri 07 November 2025 |
578.59 (-2.88%) |
585.67 |
556.22 - 596.12 |
1.2715 times |
Fri 31 October 2025 |
595.73 (0%) |
598.29 |
590.83 - 602.44 |
0.2633 times |
Fri 31 October 2025 |
595.73 (4.37%) |
575.00 |
571.59 - 612.28 |
1.4812 times |
Fri 24 October 2025 |
570.80 (4.7%) |
553.33 |
531.00 - 572.40 |
1.0503 times |
Fri 17 October 2025 |
545.17 (1.08%) |
548.44 |
538.42 - 575.07 |
1.0776 times |
Fri 10 October 2025 |
539.37 (0.25%) |
540.50 |
533.73 - 561.49 |
1.0215 times |
Fri 03 October 2025 |
538.01 (2.25%) |
531.00 |
525.98 - 550.88 |
0.9779 times |
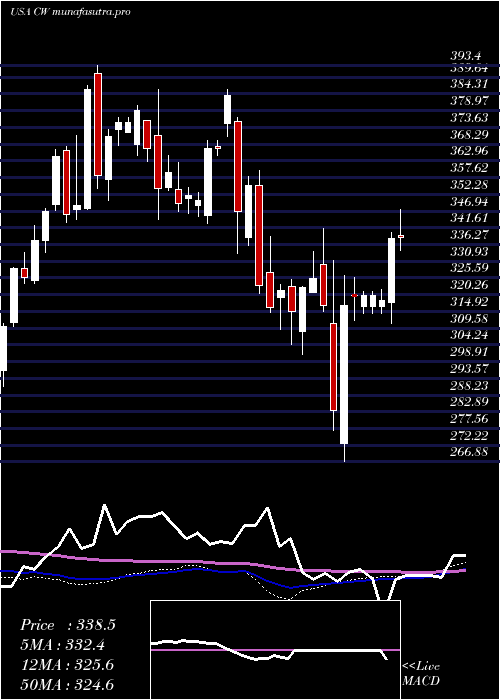
Monthly price and charts CurtissWright Strong monthly Stock price targets for CurtissWright CW are 523.73 and 555.22 | Monthly Target 1 | 514.96 | | Monthly Target 2 | 532.5 | | Monthly Target 3 | 546.45333333333 | | Monthly Target 4 | 563.99 | | Monthly Target 5 | 577.94 |
Monthly price and volumes Curtiss Wright
| Date |
Closing |
Open |
Range |
Volume |
Thu 04 December 2025 |
550.03 (-2.53%) |
557.83 |
528.92 - 560.41 |
0.1787 times |
Fri 28 November 2025 |
564.29 (-5.28%) |
585.67 |
521.66 - 596.20 |
0.8306 times |
Fri 31 October 2025 |
595.73 (9.72%) |
536.88 |
530.32 - 612.28 |
1.0699 times |
Tue 30 September 2025 |
542.94 (13.55%) |
473.82 |
465.51 - 549.00 |
1.0105 times |
Fri 29 August 2025 |
478.15 (-2.46%) |
480.44 |
464.91 - 517.09 |
1.2596 times |
Thu 31 July 2025 |
490.22 (0.34%) |
485.51 |
463.00 - 499.30 |
1.0748 times |
Mon 30 June 2025 |
488.55 (11.01%) |
440.23 |
435.35 - 490.71 |
1.3798 times |
Fri 30 May 2025 |
440.11 (27.61%) |
346.30 |
345.84 - 453.02 |
1.2894 times |
Wed 30 April 2025 |
344.89 (8.71%) |
317.27 |
266.88 - 347.49 |
0.9157 times |
Mon 31 March 2025 |
317.27 (-1.36%) |
322.91 |
301.06 - 341.39 |
0.991 times |
Fri 28 February 2025 |
321.66 (-7.29%) |
338.58 |
309.01 - 360.00 |
1.3368 times |

DMA SMA EMA moving averages of Curtiss Wright CW
DMA (daily moving average) of Curtiss Wright CW
| DMA period | DMA value | | 5 day DMA | 548.72 | | 12 day DMA | 547.06 | | 20 day DMA | 555.1 | | 35 day DMA | 562.89 | | 50 day DMA | 556.85 | | 100 day DMA | 524.2 | | 150 day DMA | 496.87 | | 200 day DMA | 452.62 | EMA (exponential moving average) of Curtiss Wright CW
| EMA period | EMA current | EMA prev | EMA prev2 | | 5 day EMA | 547.37 | 546.04 | 551.11 | | 12 day EMA | 550.44 | 550.52 | 553.18 | | 20 day EMA | 553.5 | 553.86 | 555.75 | | 35 day EMA | 552.23 | 552.36 | 553.33 | | 50 day EMA | 552.57 | 552.67 | 553.35 |
SMA (simple moving average) of Curtiss Wright CW
| SMA period | SMA current | SMA prev | SMA prev2 | | 5 day SMA | 548.72 | 551.31 | 555.19 | | 12 day SMA | 547.06 | 546.54 | 547.85 | | 20 day SMA | 555.1 | 556.86 | 559.36 | | 35 day SMA | 562.89 | 563.07 | 563.61 | | 50 day SMA | 556.85 | 556.07 | 555.72 | | 100 day SMA | 524.2 | 523.51 | 523.02 | | 150 day SMA | 496.87 | 495.51 | 494.2 | | 200 day SMA | 452.62 | 451.5 | 450.43 |
|
|
