CavcoIndustries CVCO full analysis,charts,indicators,moving averages,SMA,DMA,EMA,ADX,MACD,RSICavco Industries CVCO WideScreen charts, DMA,SMA,EMA technical analysis, forecast prediction, by indicators ADX,MACD,RSI,CCI USA stock exchange
operates under Basic Industries sector & deals in Homebuilding
Daily price and charts and targets CavcoIndustries Strong Daily Stock price targets for CavcoIndustries CVCO are 561.74 and 580.6 | Daily Target 1 | 546.02 | | Daily Target 2 | 558.6 | | Daily Target 3 | 564.88333333333 | | Daily Target 4 | 577.46 | | Daily Target 5 | 583.74 |
Daily price and volume Cavco Industries
| Date |
Closing |
Open |
Range |
Volume |
Mon 20 October 2025 |
571.17 (3%) |
555.71 |
552.31 - 571.17 |
0.6066 times |
Fri 17 October 2025 |
554.52 (2.6%) |
533.95 |
530.05 - 557.08 |
1.3121 times |
Thu 16 October 2025 |
540.47 (2.04%) |
529.29 |
527.15 - 544.02 |
0.8474 times |
Wed 15 October 2025 |
529.66 (3.66%) |
511.33 |
500.40 - 532.01 |
0.848 times |
Tue 14 October 2025 |
510.97 (3.57%) |
490.22 |
486.47 - 513.45 |
0.8695 times |
Mon 13 October 2025 |
493.35 (-0.89%) |
502.43 |
488.28 - 502.43 |
1.1337 times |
Fri 10 October 2025 |
497.78 (-1.79%) |
506.85 |
494.59 - 511.55 |
1.1034 times |
Thu 09 October 2025 |
506.85 (-3.04%) |
521.31 |
506.44 - 527.96 |
0.9975 times |
Wed 08 October 2025 |
522.74 (3.89%) |
504.00 |
497.42 - 523.01 |
1.2718 times |
Tue 07 October 2025 |
503.19 (0.84%) |
497.00 |
490.90 - 506.46 |
1.0101 times |
Mon 06 October 2025 |
499.00 (-12.52%) |
572.50 |
495.31 - 572.50 |
1.2267 times |
Weekly price and charts CavcoIndustries Strong weekly Stock price targets for CavcoIndustries CVCO are 561.74 and 580.6 | Weekly Target 1 | 546.02 | | Weekly Target 2 | 558.6 | | Weekly Target 3 | 564.88333333333 | | Weekly Target 4 | 577.46 | | Weekly Target 5 | 583.74 |
Weekly price and volumes for Cavco Industries
| Date |
Closing |
Open |
Range |
Volume |
Mon 20 October 2025 |
571.17 (3%) |
555.71 |
552.31 - 571.17 |
0.1329 times |
Fri 17 October 2025 |
554.52 (11.4%) |
502.43 |
486.47 - 557.08 |
1.0982 times |
Fri 10 October 2025 |
497.78 (-12.74%) |
572.50 |
490.90 - 572.50 |
1.2294 times |
Fri 03 October 2025 |
570.43 (-0.36%) |
575.78 |
568.98 - 600.00 |
1.2433 times |
Fri 26 September 2025 |
572.47 (2.86%) |
553.60 |
546.39 - 577.53 |
1.0923 times |
Fri 19 September 2025 |
556.53 (2.12%) |
543.58 |
535.56 - 574.20 |
1.8162 times |
Fri 12 September 2025 |
544.99 (-0.16%) |
544.93 |
533.31 - 555.70 |
1.1836 times |
Fri 05 September 2025 |
545.84 (2.89%) |
524.11 |
522.32 - 568.97 |
0.9972 times |
Fri 29 August 2025 |
530.49 (0%) |
530.38 |
508.81 - 536.57 |
0.1379 times |
Fri 29 August 2025 |
530.49 (2.11%) |
518.01 |
508.81 - 536.57 |
1.0689 times |
Fri 22 August 2025 |
519.55 (8.19%) |
479.02 |
477.41 - 524.89 |
1.2624 times |
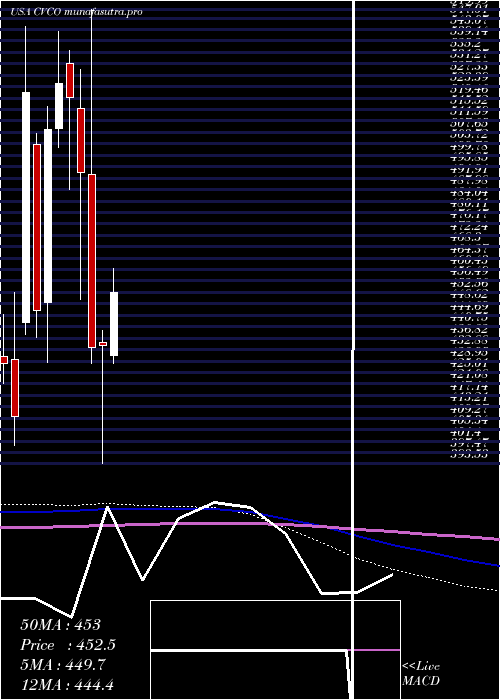
Monthly price and charts CavcoIndustries Strong monthly Stock price targets for CavcoIndustries CVCO are 473.86 and 583.78 | Monthly Target 1 | 441.42 | | Monthly Target 2 | 506.3 | | Monthly Target 3 | 551.34333333333 | | Monthly Target 4 | 616.22 | | Monthly Target 5 | 661.26 |
Monthly price and volumes Cavco Industries
| Date |
Closing |
Open |
Range |
Volume |
Mon 20 October 2025 |
571.17 (-1.65%) |
577.63 |
486.47 - 596.39 |
0.9726 times |
Tue 30 September 2025 |
580.73 (9.47%) |
524.11 |
522.32 - 600.00 |
1.7467 times |
Fri 29 August 2025 |
530.49 (31.42%) |
429.70 |
406.98 - 536.57 |
1.231 times |
Thu 31 July 2025 |
403.67 (-7.08%) |
430.94 |
397.38 - 460.62 |
1.3131 times |
Mon 30 June 2025 |
434.43 (0.19%) |
435.25 |
393.53 - 439.48 |
1.82 times |
Fri 30 May 2025 |
433.60 (-12.2%) |
493.10 |
427.97 - 549.99 |
0.8271 times |
Wed 30 April 2025 |
493.85 (-4.96%) |
515.86 |
450.20 - 529.45 |
0.5494 times |
Mon 31 March 2025 |
519.63 (-0.93%) |
531.33 |
487.94 - 535.75 |
0.5367 times |
Fri 28 February 2025 |
524.53 (3.12%) |
509.11 |
502.56 - 542.47 |
0.4733 times |
Fri 31 January 2025 |
508.64 (13.99%) |
448.97 |
428.50 - 516.42 |
0.5301 times |
Tue 31 December 2024 |
446.23 (-14.39%) |
503.31 |
437.07 - 507.35 |
0.3716 times |
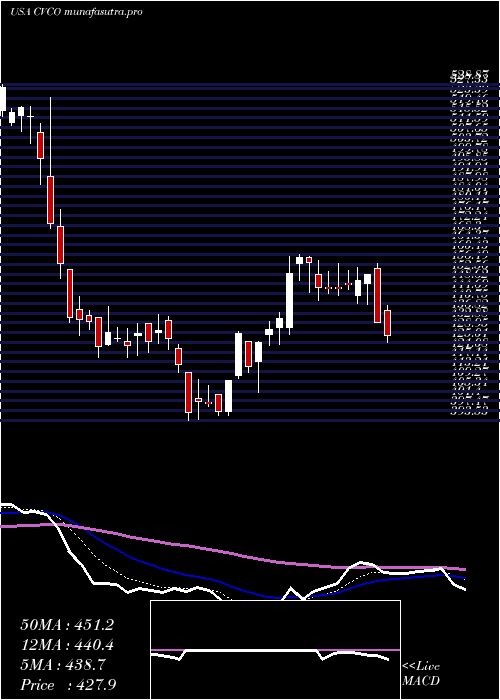
DMA SMA EMA moving averages of Cavco Industries CVCO
DMA (daily moving average) of Cavco Industries CVCO
| DMA period | DMA value | | 5 day DMA | 541.36 | | 12 day DMA | 525.01 | | 20 day DMA | 545.38 | | 35 day DMA | 546.6 | | 50 day DMA | 533.82 | | 100 day DMA | 481.33 | | 150 day DMA | 486.83 | | 200 day DMA | 489.78 | EMA (exponential moving average) of Cavco Industries CVCO
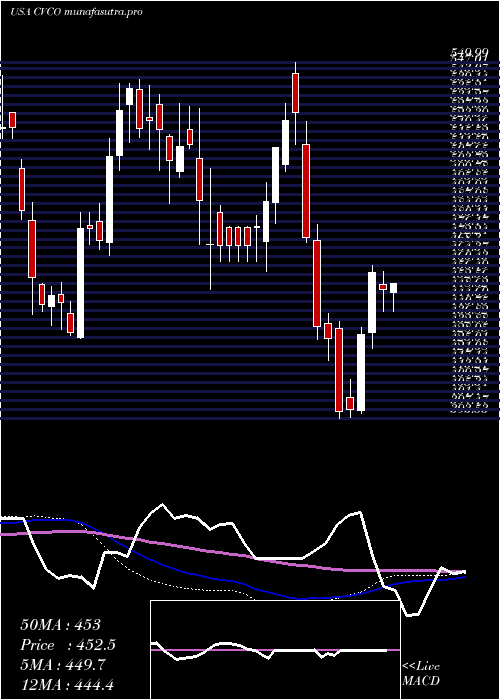
| EMA period | EMA current | EMA prev | EMA prev2 | | 5 day EMA | 546.49 | 534.15 | 523.96 | | 12 day EMA | 538.25 | 532.27 | 528.23 | | 20 day EMA | 538.58 | 535.15 | 533.11 | | 35 day EMA | 532.68 | 530.41 | 528.99 | | 50 day EMA | 527.96 | 526.2 | 525.04 |
SMA (simple moving average) of Cavco Industries CVCO
| SMA period | SMA current | SMA prev | SMA prev2 | | 5 day SMA | 541.36 | 525.79 | 514.45 | | 12 day SMA | 525.01 | 526.5 | 529.21 | | 20 day SMA | 545.38 | 544.86 | 544.96 | | 35 day SMA | 546.6 | 545.44 | 544.76 | | 50 day SMA | 533.82 | 531.4 | 529.4 | | 100 day SMA | 481.33 | 480.19 | 479.37 | | 150 day SMA | 486.83 | 486.4 | 485.98 | | 200 day SMA | 489.78 | 489.12 | 488.58 |
|
|
