CvbFinancial CVBF full analysis,charts,indicators,moving averages,SMA,DMA,EMA,ADX,MACD,RSICvb Financial CVBF WideScreen charts, DMA,SMA,EMA technical analysis, forecast prediction, by indicators ADX,MACD,RSI,CCI USA stock exchange
operates under Finance sector & deals in Major Banks
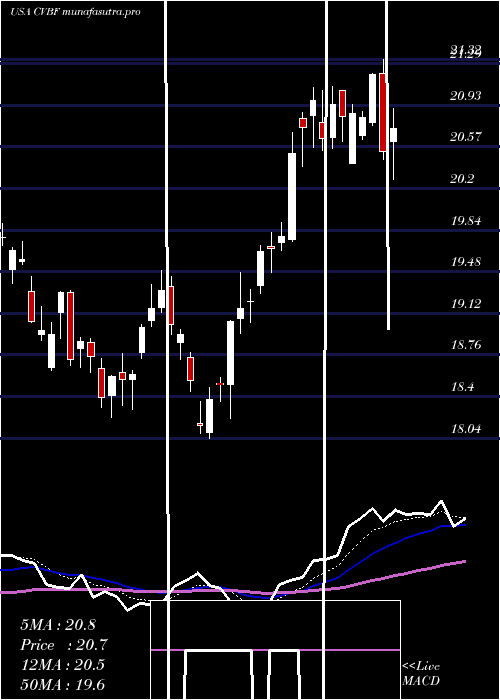
Daily price and charts and targets CvbFinancial Strong Daily Stock price targets for CvbFinancial CVBF are 19.55 and 19.92 | Daily Target 1 | 19.45 | | Daily Target 2 | 19.65 | | Daily Target 3 | 19.823333333333 | | Daily Target 4 | 20.02 | | Daily Target 5 | 20.19 |
Daily price and volume Cvb Financial
| Date |
Closing |
Open |
Range |
Volume |
Thu 04 December 2025 |
19.84 (-0.6%) |
19.88 |
19.63 - 20.00 |
0.8966 times |
Wed 03 December 2025 |
19.96 (0.91%) |
19.79 |
19.79 - 20.11 |
0.6219 times |
Tue 02 December 2025 |
19.78 (0.05%) |
19.87 |
19.64 - 19.91 |
0.6888 times |
Mon 01 December 2025 |
19.77 (0.46%) |
19.49 |
19.49 - 20.03 |
0.7724 times |
Fri 28 November 2025 |
19.68 (-1.3%) |
19.94 |
19.63 - 19.97 |
0.4871 times |
Wed 26 November 2025 |
19.94 (-1.38%) |
20.07 |
19.92 - 20.19 |
1.4552 times |
Tue 25 November 2025 |
20.22 (2.95%) |
19.75 |
19.40 - 20.45 |
1.5927 times |
Mon 24 November 2025 |
19.64 (0.87%) |
19.42 |
19.27 - 19.75 |
1.2432 times |
Fri 21 November 2025 |
19.47 (3.23%) |
18.88 |
18.88 - 19.64 |
1.136 times |
Thu 20 November 2025 |
18.86 (1.23%) |
18.70 |
18.70 - 19.09 |
1.1061 times |
Wed 19 November 2025 |
18.63 (0.92%) |
18.50 |
18.37 - 18.65 |
0.86 times |
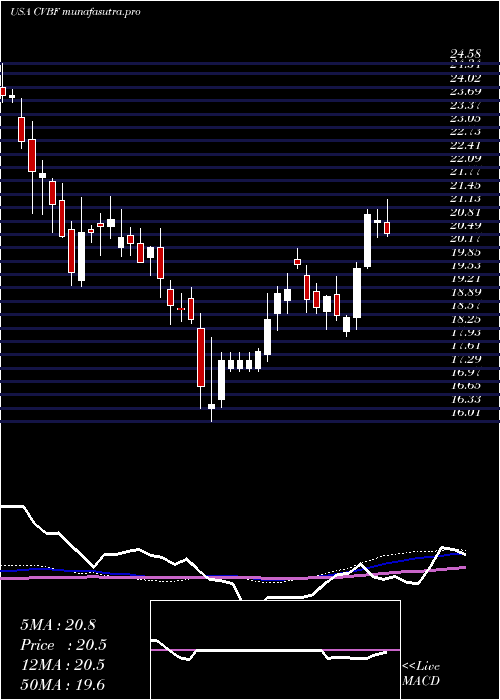
Weekly price and charts CvbFinancial Strong weekly Stock price targets for CvbFinancial CVBF are 19.67 and 20.29 | Weekly Target 1 | 19.19 | | Weekly Target 2 | 19.52 | | Weekly Target 3 | 19.813333333333 | | Weekly Target 4 | 20.14 | | Weekly Target 5 | 20.43 |
Weekly price and volumes for Cvb Financial
| Date |
Closing |
Open |
Range |
Volume |
Thu 04 December 2025 |
19.84 (0.81%) |
19.49 |
19.49 - 20.11 |
0.7525 times |
Fri 28 November 2025 |
19.68 (1.08%) |
19.42 |
19.27 - 20.45 |
1.2068 times |
Fri 21 November 2025 |
19.47 (3.23%) |
18.83 |
18.10 - 19.64 |
1.3677 times |
Fri 14 November 2025 |
18.86 (0.8%) |
18.77 |
18.29 - 19.37 |
1.3909 times |
Fri 07 November 2025 |
18.71 (1.85%) |
18.37 |
18.26 - 18.82 |
0.8375 times |
Fri 31 October 2025 |
18.37 (0%) |
18.42 |
18.29 - 18.58 |
0.2593 times |
Fri 31 October 2025 |
18.37 (-3.67%) |
19.07 |
18.29 - 19.31 |
1.157 times |
Fri 24 October 2025 |
19.07 (2.86%) |
18.61 |
18.34 - 19.19 |
1.0321 times |
Fri 17 October 2025 |
18.54 (2.71%) |
18.30 |
17.94 - 19.47 |
1.2903 times |
Fri 10 October 2025 |
18.05 (-4.9%) |
19.02 |
18.01 - 19.36 |
0.7058 times |
Fri 03 October 2025 |
18.98 (-2.11%) |
19.40 |
18.55 - 19.41 |
0.975 times |
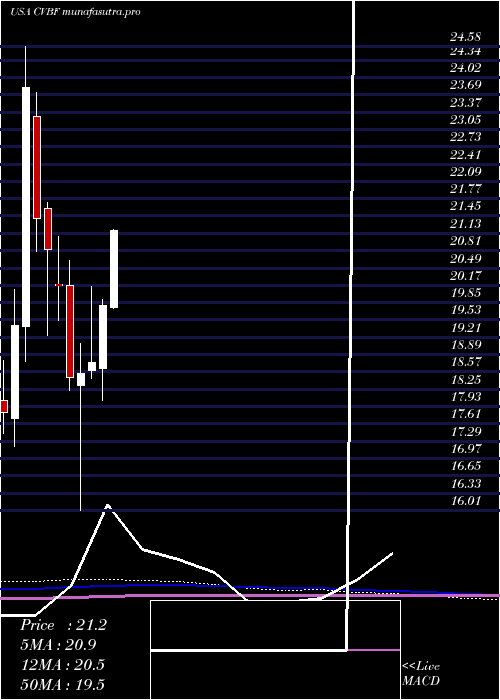
Monthly price and charts CvbFinancial Strong monthly Stock price targets for CvbFinancial CVBF are 19.67 and 20.29 | Monthly Target 1 | 19.19 | | Monthly Target 2 | 19.52 | | Monthly Target 3 | 19.813333333333 | | Monthly Target 4 | 20.14 | | Monthly Target 5 | 20.43 |
Monthly price and volumes Cvb Financial
| Date |
Closing |
Open |
Range |
Volume |
Thu 04 December 2025 |
19.84 (0.81%) |
19.49 |
19.49 - 20.11 |
0.1793 times |
Fri 28 November 2025 |
19.68 (7.13%) |
18.37 |
18.10 - 20.45 |
1.1443 times |
Fri 31 October 2025 |
18.37 (-2.86%) |
18.67 |
17.94 - 19.47 |
1.189 times |
Tue 30 September 2025 |
18.91 (-6.06%) |
19.92 |
18.73 - 20.70 |
1.0015 times |
Fri 29 August 2025 |
20.13 (7.7%) |
18.50 |
18.12 - 20.50 |
0.8922 times |
Thu 31 July 2025 |
18.69 (-5.56%) |
19.76 |
18.53 - 21.34 |
1.3646 times |
Mon 30 June 2025 |
19.79 (5.55%) |
18.64 |
18.04 - 19.91 |
1.0911 times |
Fri 30 May 2025 |
18.75 (1.13%) |
18.60 |
18.45 - 20.15 |
0.7786 times |
Wed 30 April 2025 |
18.54 (0.43%) |
18.32 |
16.01 - 19.09 |
1.3023 times |
Mon 31 March 2025 |
18.46 (-8.48%) |
20.17 |
18.22 - 20.64 |
1.0571 times |
Fri 28 February 2025 |
20.17 (-3.21%) |
20.19 |
19.52 - 21.08 |
0.804 times |
DMA SMA EMA moving averages of Cvb Financial CVBF
DMA (daily moving average) of Cvb Financial CVBF
| DMA period | DMA value | | 5 day DMA | 19.81 | | 12 day DMA | 19.52 | | 20 day DMA | 19.17 | | 35 day DMA | 18.95 | | 50 day DMA | 18.94 | | 100 day DMA | 19.38 | | 150 day DMA | 19.4 | | 200 day DMA | 19.17 | EMA (exponential moving average) of Cvb Financial CVBF
| EMA period | EMA current | EMA prev | EMA prev2 | | 5 day EMA | 19.82 | 19.81 | 19.73 | | 12 day EMA | 19.56 | 19.51 | 19.43 | | 20 day EMA | 19.36 | 19.31 | 19.24 | | 35 day EMA | 19.22 | 19.18 | 19.13 | | 50 day EMA | 19.1 | 19.07 | 19.03 |
SMA (simple moving average) of Cvb Financial CVBF
| SMA period | SMA current | SMA prev | SMA prev2 | | 5 day SMA | 19.81 | 19.83 | 19.88 | | 12 day SMA | 19.52 | 19.38 | 19.29 | | 20 day SMA | 19.17 | 19.11 | 19.04 | | 35 day SMA | 18.95 | 18.93 | 18.91 | | 50 day SMA | 18.94 | 18.94 | 18.93 | | 100 day SMA | 19.38 | 19.39 | 19.4 | | 150 day SMA | 19.4 | 19.39 | 19.38 | | 200 day SMA | 19.17 | 19.17 | 19.17 |
|
|
