CarnivalCorporation CUK full analysis,charts,indicators,moving averages,SMA,DMA,EMA,ADX,MACD,RSICarnival Corporation CUK WideScreen charts, DMA,SMA,EMA technical analysis, forecast prediction, by indicators ADX,MACD,RSI,CCI USA stock exchange
operates under Consumer Services sector & deals in Marine Transportation
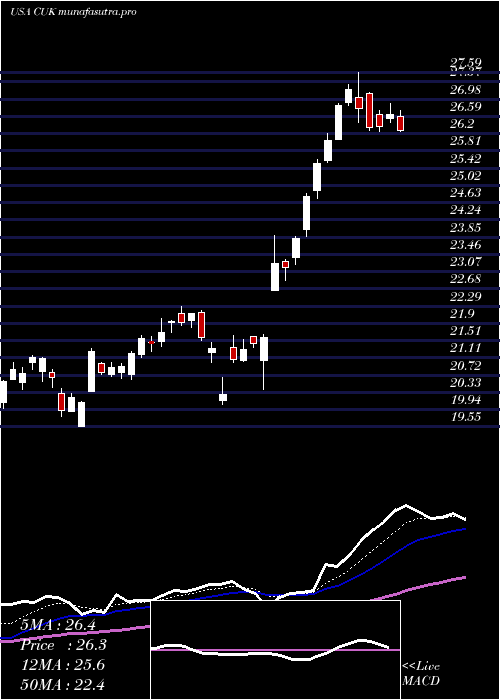
Daily price and charts and targets CarnivalCorporation Strong Daily Stock price targets for CarnivalCorporation CUK are 23.45 and 23.89 | Daily Target 1 | 23.35 | | Daily Target 2 | 23.55 | | Daily Target 3 | 23.793333333333 | | Daily Target 4 | 23.99 | | Daily Target 5 | 24.23 |
Daily price and volume Carnival Corporation
| Date |
Closing |
Open |
Range |
Volume |
Thu 04 December 2025 |
23.74 (-0.88%) |
24.01 |
23.60 - 24.04 |
0.7274 times |
Wed 03 December 2025 |
23.95 (0.8%) |
23.82 |
23.61 - 24.09 |
0.728 times |
Tue 02 December 2025 |
23.76 (-0.46%) |
24.18 |
23.50 - 24.18 |
0.5707 times |
Mon 01 December 2025 |
23.87 (0.17%) |
23.85 |
23.59 - 24.01 |
0.8783 times |
Fri 28 November 2025 |
23.83 (1.53%) |
23.78 |
23.60 - 24.03 |
0.6243 times |
Wed 26 November 2025 |
23.47 (-0.55%) |
23.89 |
23.42 - 23.89 |
1.0999 times |
Tue 25 November 2025 |
23.60 (3.01%) |
22.71 |
22.69 - 24.14 |
1.3361 times |
Mon 24 November 2025 |
22.91 (-5.02%) |
24.29 |
22.80 - 24.36 |
2.3742 times |
Fri 21 November 2025 |
24.12 (4.6%) |
23.52 |
23.26 - 24.33 |
0.9135 times |
Thu 20 November 2025 |
23.06 (-2.78%) |
23.87 |
23.03 - 24.16 |
0.7476 times |
Wed 19 November 2025 |
23.72 (0.89%) |
23.74 |
23.49 - 23.98 |
0.5998 times |
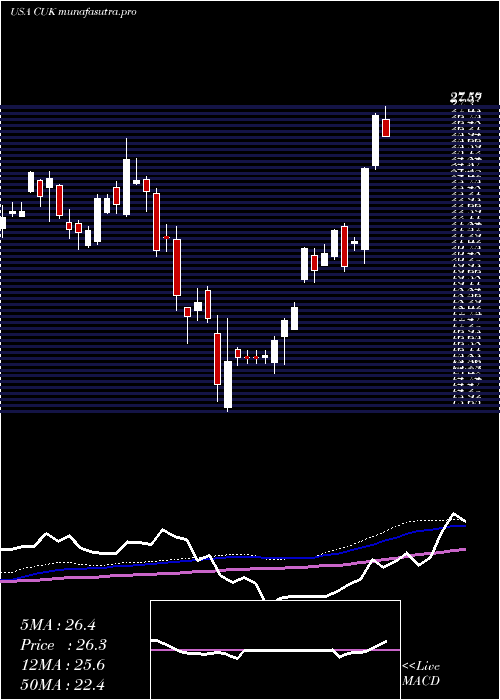
Weekly price and charts CarnivalCorporation Strong weekly Stock price targets for CarnivalCorporation CUK are 23.28 and 23.96 | Weekly Target 1 | 23.13 | | Weekly Target 2 | 23.43 | | Weekly Target 3 | 23.806666666667 | | Weekly Target 4 | 24.11 | | Weekly Target 5 | 24.49 |
Weekly price and volumes for Carnival Corporation
| Date |
Closing |
Open |
Range |
Volume |
Thu 04 December 2025 |
23.74 (-0.38%) |
23.85 |
23.50 - 24.18 |
0.9009 times |
Fri 28 November 2025 |
23.83 (-1.2%) |
24.29 |
22.69 - 24.36 |
1.6857 times |
Fri 21 November 2025 |
24.12 (1.52%) |
23.67 |
22.95 - 24.33 |
1.1065 times |
Fri 14 November 2025 |
23.76 (-1.7%) |
24.48 |
23.12 - 25.23 |
1.0325 times |
Fri 07 November 2025 |
24.17 (-7.07%) |
24.50 |
23.54 - 24.71 |
1.2523 times |
Fri 31 October 2025 |
26.01 (0%) |
25.50 |
25.31 - 26.12 |
0.2237 times |
Fri 31 October 2025 |
26.01 (-2%) |
26.82 |
25.02 - 26.97 |
1.1302 times |
Fri 24 October 2025 |
26.54 (3.07%) |
25.80 |
25.79 - 27.42 |
1.1293 times |
Fri 17 October 2025 |
25.75 (-1.79%) |
25.69 |
25.09 - 26.77 |
1.0649 times |
Tue 07 October 2025 |
26.22 (-0.46%) |
26.31 |
25.68 - 26.76 |
0.4739 times |
Fri 03 October 2025 |
26.34 (-4.77%) |
29.27 |
25.92 - 29.45 |
2.1925 times |
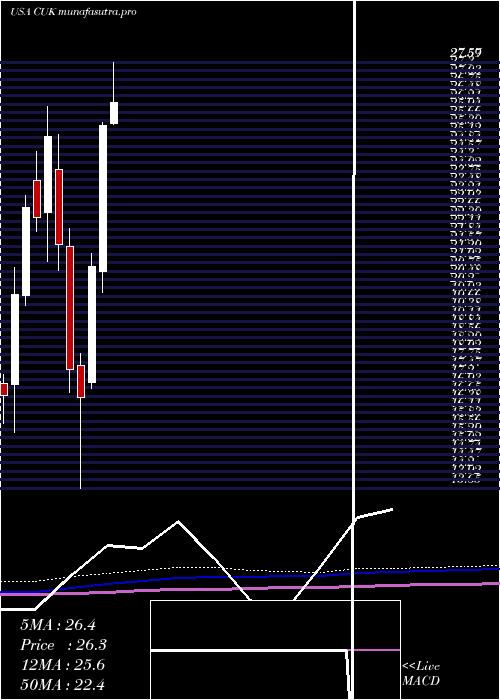
Monthly price and charts CarnivalCorporation Strong monthly Stock price targets for CarnivalCorporation CUK are 23.28 and 23.96 | Monthly Target 1 | 23.13 | | Monthly Target 2 | 23.43 | | Monthly Target 3 | 23.806666666667 | | Monthly Target 4 | 24.11 | | Monthly Target 5 | 24.49 |
Monthly price and volumes Carnival Corporation
| Date |
Closing |
Open |
Range |
Volume |
Thu 04 December 2025 |
23.74 (-0.38%) |
23.85 |
23.50 - 24.18 |
0.1793 times |
Fri 28 November 2025 |
23.83 (-8.38%) |
24.50 |
22.69 - 25.23 |
1.0105 times |
Fri 31 October 2025 |
26.01 (-1.63%) |
26.33 |
25.02 - 27.42 |
0.9733 times |
Tue 30 September 2025 |
26.44 (-9.05%) |
27.81 |
26.09 - 29.80 |
1.1066 times |
Fri 29 August 2025 |
29.07 (6.88%) |
26.48 |
25.67 - 29.77 |
0.8498 times |
Thu 31 July 2025 |
27.20 (6.62%) |
25.58 |
25.54 - 28.29 |
1.3276 times |
Mon 30 June 2025 |
25.51 (22%) |
20.73 |
20.05 - 25.60 |
1.3127 times |
Fri 30 May 2025 |
20.91 (25.81%) |
17.12 |
16.92 - 21.32 |
0.9872 times |
Wed 30 April 2025 |
16.62 (-5.19%) |
17.66 |
13.65 - 18.06 |
1.0677 times |
Mon 31 March 2025 |
17.53 (-18.92%) |
21.55 |
16.79 - 22.14 |
1.1853 times |
Fri 28 February 2025 |
21.62 (-14.1%) |
24.09 |
20.76 - 25.23 |
0.9347 times |
DMA SMA EMA moving averages of Carnival Corporation CUK
DMA (daily moving average) of Carnival Corporation CUK
| DMA period | DMA value | | 5 day DMA | 23.83 | | 12 day DMA | 23.63 | | 20 day DMA | 23.78 | | 35 day DMA | 24.67 | | 50 day DMA | 25.3 | | 100 day DMA | 26.53 | | 150 day DMA | 24.84 | | 200 day DMA | 23.24 | EMA (exponential moving average) of Carnival Corporation CUK
| EMA period | EMA current | EMA prev | EMA prev2 | | 5 day EMA | 23.77 | 23.79 | 23.71 | | 12 day EMA | 23.79 | 23.8 | 23.77 | | 20 day EMA | 24.03 | 24.06 | 24.07 | | 35 day EMA | 24.65 | 24.7 | 24.74 | | 50 day EMA | 25.4 | 25.47 | 25.53 |
SMA (simple moving average) of Carnival Corporation CUK
| SMA period | SMA current | SMA prev | SMA prev2 | | 5 day SMA | 23.83 | 23.78 | 23.71 | | 12 day SMA | 23.63 | 23.58 | 23.56 | | 20 day SMA | 23.78 | 23.81 | 23.8 | | 35 day SMA | 24.67 | 24.74 | 24.81 | | 50 day SMA | 25.3 | 25.38 | 25.47 | | 100 day SMA | 26.53 | 26.56 | 26.58 | | 150 day SMA | 24.84 | 24.79 | 24.74 | | 200 day SMA | 23.24 | 23.24 | 23.24 |
|
|
