CtsCorporation CTS full analysis,charts,indicators,moving averages,SMA,DMA,EMA,ADX,MACD,RSICts Corporation CTS WideScreen charts, DMA,SMA,EMA technical analysis, forecast prediction, by indicators ADX,MACD,RSI,CCI USA stock exchange
operates under Technology sector & deals in Electrical Products
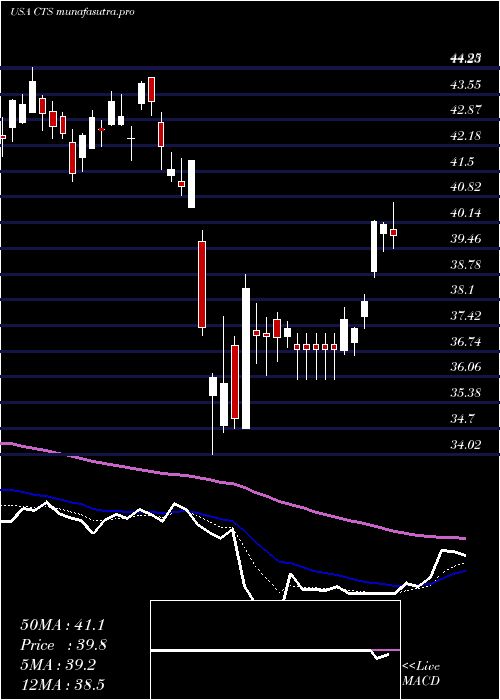
Daily price and charts and targets CtsCorporation Strong Daily Stock price targets for CtsCorporation CTS are 40.74 and 41.75 | Daily Target 1 | 39.9 | | Daily Target 2 | 40.56 | | Daily Target 3 | 40.91 | | Daily Target 4 | 41.57 | | Daily Target 5 | 41.92 |
Daily price and volume Cts Corporation
| Date |
Closing |
Open |
Range |
Volume |
Mon 20 October 2025 |
41.22 (2.97%) |
40.25 |
40.25 - 41.26 |
0.7232 times |
Fri 17 October 2025 |
40.03 (-2.39%) |
40.76 |
39.80 - 41.49 |
1.1977 times |
Thu 16 October 2025 |
41.01 (3.38%) |
39.75 |
39.57 - 41.09 |
1.2754 times |
Wed 15 October 2025 |
39.67 (3.74%) |
38.69 |
38.25 - 39.70 |
0.8796 times |
Tue 14 October 2025 |
38.24 (4.85%) |
36.04 |
36.03 - 38.26 |
1.4896 times |
Mon 13 October 2025 |
36.47 (-0.73%) |
37.46 |
36.37 - 37.67 |
1.2699 times |
Fri 10 October 2025 |
36.74 (-4.1%) |
38.40 |
36.66 - 38.69 |
0.8077 times |
Thu 09 October 2025 |
38.31 (-1.19%) |
38.80 |
38.04 - 38.80 |
0.6155 times |
Wed 08 October 2025 |
38.77 (1.25%) |
38.43 |
38.15 - 38.87 |
0.5289 times |
Tue 07 October 2025 |
38.29 (-4.49%) |
40.15 |
38.13 - 40.19 |
1.2125 times |
Mon 06 October 2025 |
40.09 (1.06%) |
40.05 |
39.67 - 40.41 |
0.5311 times |
Weekly price and charts CtsCorporation Strong weekly Stock price targets for CtsCorporation CTS are 40.74 and 41.75 | Weekly Target 1 | 39.9 | | Weekly Target 2 | 40.56 | | Weekly Target 3 | 40.91 | | Weekly Target 4 | 41.57 | | Weekly Target 5 | 41.92 |
Weekly price and volumes for Cts Corporation
| Date |
Closing |
Open |
Range |
Volume |
Mon 20 October 2025 |
41.22 (2.97%) |
40.25 |
40.25 - 41.26 |
0.2305 times |
Fri 17 October 2025 |
40.03 (8.95%) |
37.46 |
36.03 - 41.49 |
1.9476 times |
Fri 10 October 2025 |
36.74 (-7.39%) |
40.05 |
36.66 - 40.41 |
1.1776 times |
Fri 03 October 2025 |
39.67 (0.89%) |
39.75 |
38.61 - 40.63 |
1.0847 times |
Fri 26 September 2025 |
39.32 (-5.73%) |
41.59 |
39.08 - 42.57 |
1.2386 times |
Fri 19 September 2025 |
41.71 (0%) |
41.90 |
41.35 - 42.88 |
1.6378 times |
Fri 12 September 2025 |
41.71 (-1.51%) |
42.27 |
41.07 - 42.91 |
0.8454 times |
Fri 05 September 2025 |
42.35 (-0.33%) |
41.72 |
41.40 - 43.23 |
0.6671 times |
Fri 29 August 2025 |
42.49 (0%) |
43.06 |
42.33 - 43.06 |
0.1905 times |
Fri 29 August 2025 |
42.49 (-2.41%) |
43.56 |
42.15 - 43.56 |
0.9803 times |
Fri 22 August 2025 |
43.54 (6.27%) |
40.91 |
40.89 - 43.72 |
0.9726 times |
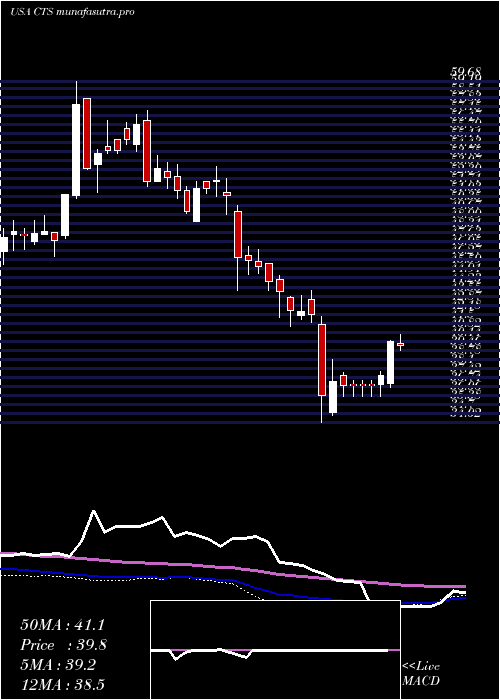
Monthly price and charts CtsCorporation Strong monthly Stock price targets for CtsCorporation CTS are 38.63 and 44.09 | Monthly Target 1 | 34.12 | | Monthly Target 2 | 37.67 | | Monthly Target 3 | 39.58 | | Monthly Target 4 | 43.13 | | Monthly Target 5 | 45.04 |
Monthly price and volumes Cts Corporation
| Date |
Closing |
Open |
Range |
Volume |
Mon 20 October 2025 |
41.22 (3.2%) |
39.51 |
36.03 - 41.49 |
0.7924 times |
Tue 30 September 2025 |
39.94 (-6%) |
41.72 |
38.61 - 43.23 |
1.0209 times |
Fri 29 August 2025 |
42.49 (8.42%) |
38.43 |
37.96 - 43.72 |
0.9382 times |
Thu 31 July 2025 |
39.19 (-8.03%) |
42.48 |
38.96 - 45.26 |
1.5643 times |
Mon 30 June 2025 |
42.61 (4.72%) |
40.44 |
40.16 - 43.93 |
0.9159 times |
Fri 30 May 2025 |
40.69 (6.85%) |
38.85 |
38.12 - 43.64 |
0.996 times |
Wed 30 April 2025 |
38.08 (-8.35%) |
41.23 |
34.02 - 41.84 |
1.372 times |
Mon 31 March 2025 |
41.55 (-6.96%) |
44.76 |
41.23 - 45.11 |
0.8375 times |
Fri 28 February 2025 |
44.66 (-12.59%) |
49.88 |
43.93 - 50.37 |
0.8136 times |
Fri 31 January 2025 |
51.09 (-3.11%) |
52.97 |
49.15 - 53.48 |
0.7493 times |
Tue 31 December 2024 |
52.73 (-3.18%) |
56.13 |
51.81 - 57.49 |
0.7039 times |

DMA SMA EMA moving averages of Cts Corporation CTS
DMA (daily moving average) of Cts Corporation CTS
| DMA period | DMA value | | 5 day DMA | 40.03 | | 12 day DMA | 39.04 | | 20 day DMA | 39.41 | | 35 day DMA | 40.51 | | 50 day DMA | 40.99 | | 100 day DMA | 41.28 | | 150 day DMA | 40.78 | | 200 day DMA | 42.48 | EMA (exponential moving average) of Cts Corporation CTS
| EMA period | EMA current | EMA prev | EMA prev2 | | 5 day EMA | 40.1 | 39.54 | 39.29 | | 12 day EMA | 39.57 | 39.27 | 39.13 | | 20 day EMA | 39.7 | 39.54 | 39.49 | | 35 day EMA | 40.07 | 40 | 40 | | 50 day EMA | 40.74 | 40.72 | 40.75 |
SMA (simple moving average) of Cts Corporation CTS
| SMA period | SMA current | SMA prev | SMA prev2 | | 5 day SMA | 40.03 | 39.08 | 38.43 | | 12 day SMA | 39.04 | 38.92 | 38.88 | | 20 day SMA | 39.41 | 39.44 | 39.52 | | 35 day SMA | 40.51 | 40.54 | 40.61 | | 50 day SMA | 40.99 | 40.96 | 40.94 | | 100 day SMA | 41.28 | 41.28 | 41.28 | | 150 day SMA | 40.78 | 40.79 | 40.81 | | 200 day SMA | 42.48 | 42.54 | 42.6 |
|
|
