CommunityTrust CTBI full analysis,charts,indicators,moving averages,SMA,DMA,EMA,ADX,MACD,RSICommunity Trust CTBI WideScreen charts, DMA,SMA,EMA technical analysis, forecast prediction, by indicators ADX,MACD,RSI,CCI USA stock exchange
operates under Finance sector & deals in Major Banks
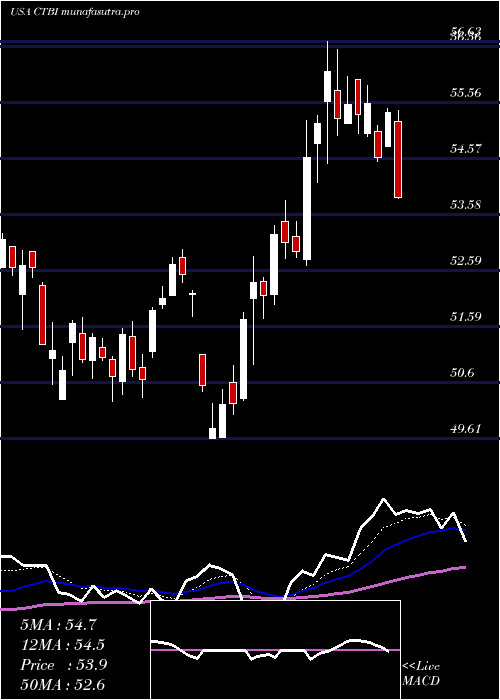
Daily price and charts and targets CommunityTrust Strong Daily Stock price targets for CommunityTrust CTBI are 56.93 and 57.73 | Daily Target 1 | 56.32 | | Daily Target 2 | 56.74 | | Daily Target 3 | 57.12 | | Daily Target 4 | 57.54 | | Daily Target 5 | 57.92 |
Daily price and volume Community Trust
| Date |
Closing |
Open |
Range |
Volume |
Thu 04 December 2025 |
57.16 (0.14%) |
56.76 |
56.70 - 57.50 |
0.9377 times |
Wed 03 December 2025 |
57.08 (2.24%) |
56.11 |
56.00 - 57.15 |
0.922 times |
Tue 02 December 2025 |
55.83 (-0.25%) |
55.97 |
55.50 - 56.42 |
0.6363 times |
Mon 01 December 2025 |
55.97 (0.85%) |
54.99 |
54.99 - 56.14 |
1.182 times |
Fri 28 November 2025 |
55.50 (-0.61%) |
55.65 |
54.83 - 55.77 |
0.5437 times |
Wed 26 November 2025 |
55.84 (-0.5%) |
55.82 |
55.64 - 56.06 |
1.0678 times |
Tue 25 November 2025 |
56.12 (2.07%) |
55.26 |
54.95 - 56.41 |
1.0914 times |
Mon 24 November 2025 |
54.98 (-0.74%) |
55.20 |
54.71 - 55.91 |
1.1111 times |
Fri 21 November 2025 |
55.39 (3.51%) |
53.62 |
53.59 - 55.80 |
1.2924 times |
Thu 20 November 2025 |
53.51 (0.22%) |
53.96 |
53.23 - 54.49 |
1.2155 times |
Wed 19 November 2025 |
53.39 (1.12%) |
52.65 |
52.65 - 53.50 |
0.8826 times |
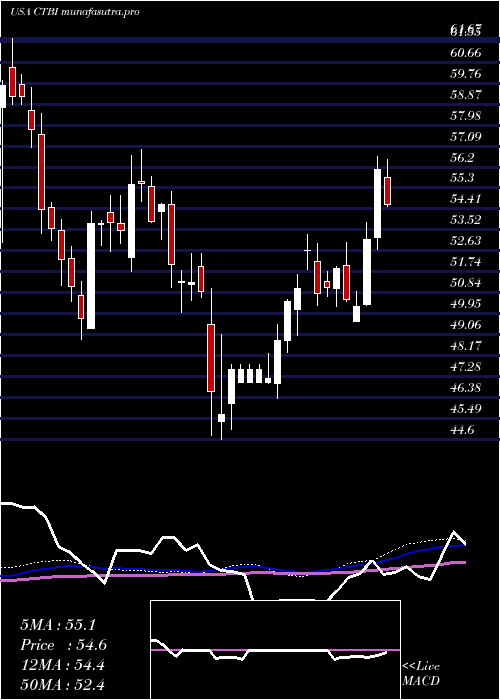
Weekly price and charts CommunityTrust Strong weekly Stock price targets for CommunityTrust CTBI are 56.08 and 58.59 | Weekly Target 1 | 54.04 | | Weekly Target 2 | 55.6 | | Weekly Target 3 | 56.55 | | Weekly Target 4 | 58.11 | | Weekly Target 5 | 59.06 |
Weekly price and volumes for Community Trust
| Date |
Closing |
Open |
Range |
Volume |
Thu 04 December 2025 |
57.16 (2.99%) |
54.99 |
54.99 - 57.50 |
0.6912 times |
Fri 28 November 2025 |
55.50 (0.2%) |
55.20 |
54.71 - 56.41 |
0.7168 times |
Fri 21 November 2025 |
55.39 (1.97%) |
54.17 |
52.55 - 55.80 |
1.0818 times |
Fri 14 November 2025 |
54.32 (2.53%) |
52.98 |
52.47 - 54.77 |
0.7682 times |
Fri 07 November 2025 |
52.98 (3.48%) |
51.60 |
51.38 - 53.02 |
0.8252 times |
Fri 31 October 2025 |
51.20 (0%) |
51.17 |
50.25 - 51.47 |
0.2629 times |
Fri 31 October 2025 |
51.20 (-3.09%) |
52.97 |
50.25 - 53.50 |
1.709 times |
Fri 24 October 2025 |
52.83 (1.27%) |
52.67 |
52.18 - 53.70 |
0.9434 times |
Fri 17 October 2025 |
52.17 (-2.16%) |
54.32 |
50.65 - 56.22 |
1.5679 times |
Fri 10 October 2025 |
53.32 (-3.46%) |
55.63 |
53.32 - 56.99 |
1.4335 times |
Fri 03 October 2025 |
55.23 (-2.23%) |
56.58 |
54.50 - 56.58 |
0.9671 times |
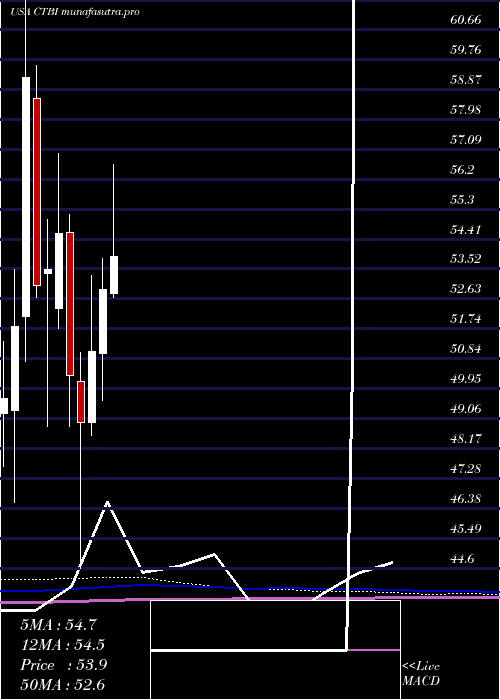
Monthly price and charts CommunityTrust Strong monthly Stock price targets for CommunityTrust CTBI are 56.08 and 58.59 | Monthly Target 1 | 54.04 | | Monthly Target 2 | 55.6 | | Monthly Target 3 | 56.55 | | Monthly Target 4 | 58.11 | | Monthly Target 5 | 59.06 |
Monthly price and volumes Community Trust
| Date |
Closing |
Open |
Range |
Volume |
Thu 04 December 2025 |
57.16 (2.99%) |
54.99 |
54.99 - 57.50 |
0.1719 times |
Fri 28 November 2025 |
55.50 (8.4%) |
51.60 |
51.38 - 56.41 |
0.8435 times |
Fri 31 October 2025 |
51.20 (-8.49%) |
55.72 |
50.25 - 56.99 |
1.6171 times |
Tue 30 September 2025 |
55.95 (-4.23%) |
58.10 |
55.35 - 59.67 |
1.0342 times |
Fri 29 August 2025 |
58.42 (8.23%) |
53.59 |
52.60 - 59.04 |
0.9914 times |
Thu 31 July 2025 |
53.98 (2%) |
52.78 |
52.68 - 57.96 |
1.1546 times |
Mon 30 June 2025 |
52.92 (3.66%) |
51.01 |
49.61 - 53.83 |
1.1334 times |
Fri 30 May 2025 |
51.05 (4.27%) |
48.94 |
48.57 - 53.33 |
0.8367 times |
Wed 30 April 2025 |
48.96 (-2.78%) |
50.16 |
44.60 - 51.03 |
1.2583 times |
Mon 31 March 2025 |
50.36 (-7.75%) |
54.60 |
48.82 - 55.15 |
0.9589 times |
Fri 28 February 2025 |
54.59 (2.02%) |
52.33 |
51.76 - 56.96 |
0.9472 times |
DMA SMA EMA moving averages of Community Trust CTBI
DMA (daily moving average) of Community Trust CTBI
| DMA period | DMA value | | 5 day DMA | 56.31 | | 12 day DMA | 55.3 | | 20 day DMA | 54.61 | | 35 day DMA | 53.53 | | 50 day DMA | 54.04 | | 100 day DMA | 55.23 | | 150 day DMA | 54.24 | | 200 day DMA | 53.23 | EMA (exponential moving average) of Community Trust CTBI
| EMA period | EMA current | EMA prev | EMA prev2 | | 5 day EMA | 56.47 | 56.12 | 55.64 | | 12 day EMA | 55.58 | 55.29 | 54.96 | | 20 day EMA | 54.97 | 54.74 | 54.49 | | 35 day EMA | 54.7 | 54.56 | 54.41 | | 50 day EMA | 54.47 | 54.36 | 54.25 |
SMA (simple moving average) of Community Trust CTBI
| SMA period | SMA current | SMA prev | SMA prev2 | | 5 day SMA | 56.31 | 56.04 | 55.85 | | 12 day SMA | 55.3 | 54.93 | 54.7 | | 20 day SMA | 54.61 | 54.38 | 54.12 | | 35 day SMA | 53.53 | 53.42 | 53.39 | | 50 day SMA | 54.04 | 54.02 | 54 | | 100 day SMA | 55.23 | 55.2 | 55.18 | | 150 day SMA | 54.24 | 54.19 | 54.14 | | 200 day SMA | 53.23 | 53.23 | 53.22 |
|
|
