CintasCorporation CTAS full analysis,charts,indicators,moving averages,SMA,DMA,EMA,ADX,MACD,RSICintas Corporation CTAS WideScreen charts, DMA,SMA,EMA technical analysis, forecast prediction, by indicators ADX,MACD,RSI,CCI USA stock exchange
operates under Consumer Non Durables sector & deals in Apparel
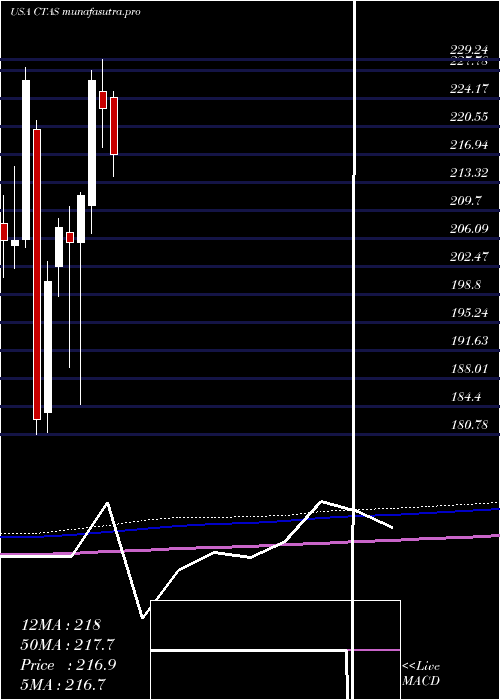
Daily price and charts and targets CintasCorporation Strong Daily Stock price targets for CintasCorporation CTAS are 194.04 and 200.07 | Daily Target 1 | 189.2 | | Daily Target 2 | 192.85 | | Daily Target 3 | 195.23333333333 | | Daily Target 4 | 198.88 | | Daily Target 5 | 201.26 |
Daily price and volume Cintas Corporation
| Date |
Closing |
Open |
Range |
Volume |
Tue 21 October 2025 |
196.49 (2.16%) |
192.29 |
191.59 - 197.62 |
1.3508 times |
Mon 20 October 2025 |
192.33 (2.25%) |
188.26 |
188.19 - 193.81 |
1.4348 times |
Fri 17 October 2025 |
188.10 (2.03%) |
184.93 |
184.88 - 189.40 |
1.0097 times |
Thu 16 October 2025 |
184.36 (-1.65%) |
187.98 |
183.95 - 187.98 |
0.6407 times |
Wed 15 October 2025 |
187.45 (-0.41%) |
188.33 |
186.98 - 189.57 |
0.6057 times |
Tue 14 October 2025 |
188.23 (0.15%) |
187.37 |
185.52 - 189.48 |
1.0864 times |
Mon 13 October 2025 |
187.94 (-0.01%) |
187.47 |
186.95 - 189.44 |
0.8421 times |
Fri 10 October 2025 |
187.96 (-1.98%) |
191.21 |
187.29 - 192.06 |
1.3782 times |
Thu 09 October 2025 |
191.75 (-3.55%) |
198.40 |
191.37 - 198.86 |
1.0455 times |
Wed 08 October 2025 |
198.81 (-0.18%) |
199.39 |
197.55 - 199.39 |
0.6061 times |
Tue 07 October 2025 |
199.17 (0.55%) |
199.04 |
197.01 - 199.70 |
0.7342 times |
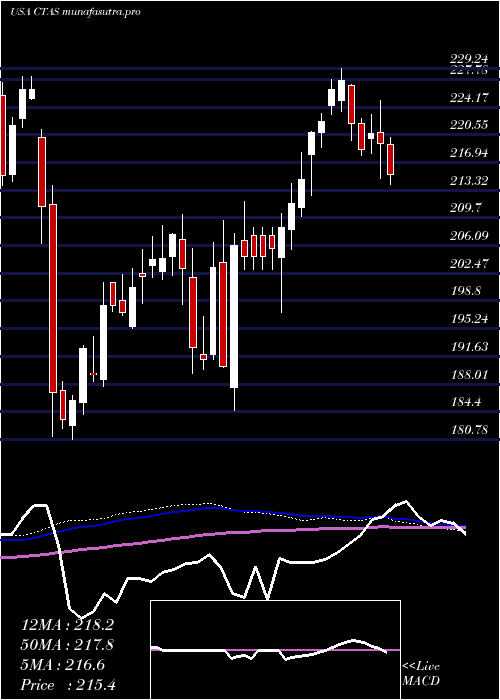
Weekly price and charts CintasCorporation Strong weekly Stock price targets for CintasCorporation CTAS are 192.34 and 201.77 | Weekly Target 1 | 184.67 | | Weekly Target 2 | 190.58 | | Weekly Target 3 | 194.1 | | Weekly Target 4 | 200.01 | | Weekly Target 5 | 203.53 |
Weekly price and volumes for Cintas Corporation
| Date |
Closing |
Open |
Range |
Volume |
Tue 21 October 2025 |
196.49 (4.46%) |
188.26 |
188.19 - 197.62 |
0.7497 times |
Fri 17 October 2025 |
188.10 (0.07%) |
187.47 |
183.95 - 189.57 |
1.1263 times |
Fri 10 October 2025 |
187.96 (-7.23%) |
202.07 |
187.29 - 202.71 |
1.1212 times |
Fri 03 October 2025 |
202.61 (-0.8%) |
205.70 |
201.44 - 205.93 |
0.8221 times |
Fri 26 September 2025 |
204.24 (2.05%) |
199.91 |
192.50 - 204.73 |
1.4062 times |
Fri 19 September 2025 |
200.13 (-1.11%) |
202.37 |
198.01 - 202.99 |
1.2733 times |
Fri 12 September 2025 |
202.37 (-1.04%) |
204.36 |
199.96 - 205.23 |
1.0724 times |
Fri 05 September 2025 |
204.50 (-2.63%) |
207.54 |
203.25 - 208.70 |
0.8151 times |
Fri 29 August 2025 |
210.03 (0%) |
208.76 |
207.67 - 210.22 |
0.1914 times |
Fri 29 August 2025 |
210.03 (-2.58%) |
214.83 |
206.54 - 215.30 |
1.4223 times |
Fri 22 August 2025 |
215.59 (-0.44%) |
216.62 |
214.01 - 219.87 |
0.8702 times |
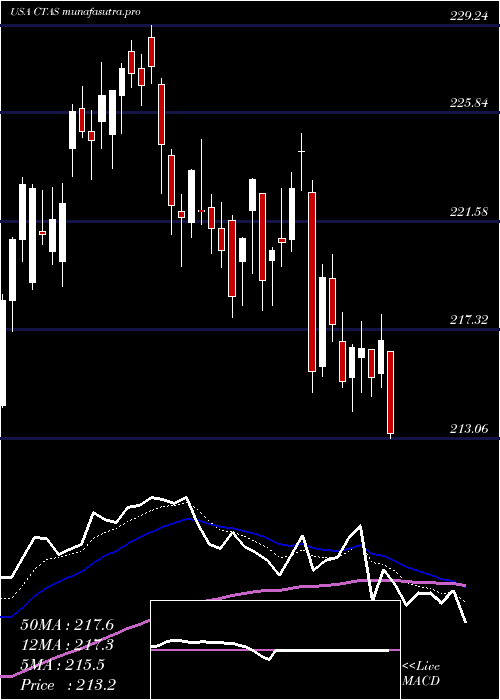
Monthly price and charts CintasCorporation Strong monthly Stock price targets for CintasCorporation CTAS are 179.83 and 200.62 | Monthly Target 1 | 174.27 | | Monthly Target 2 | 185.38 | | Monthly Target 3 | 195.06 | | Monthly Target 4 | 206.17 | | Monthly Target 5 | 215.85 |
Monthly price and volumes Cintas Corporation
| Date |
Closing |
Open |
Range |
Volume |
Tue 21 October 2025 |
196.49 (-4.27%) |
204.07 |
183.95 - 204.74 |
0.8949 times |
Tue 30 September 2025 |
205.26 (-2.27%) |
207.54 |
192.50 - 208.70 |
1.2955 times |
Fri 29 August 2025 |
210.03 (-5.63%) |
222.61 |
206.54 - 226.75 |
1.0146 times |
Thu 31 July 2025 |
222.55 (-0.14%) |
224.30 |
210.49 - 225.87 |
0.9163 times |
Mon 30 June 2025 |
222.87 (-1.6%) |
225.00 |
217.80 - 229.24 |
0.7805 times |
Fri 30 May 2025 |
226.50 (7%) |
210.33 |
206.78 - 227.80 |
0.8327 times |
Wed 30 April 2025 |
211.68 (2.99%) |
205.55 |
184.61 - 212.00 |
1.3032 times |
Mon 31 March 2025 |
205.53 (-0.95%) |
206.86 |
189.37 - 210.16 |
0.9216 times |
Fri 28 February 2025 |
207.50 (3.46%) |
202.42 |
198.59 - 208.66 |
0.8818 times |
Fri 31 January 2025 |
200.57 (9.78%) |
183.59 |
180.98 - 203.12 |
1.1589 times |
Tue 31 December 2024 |
182.70 (-19.33%) |
220.15 |
180.78 - 221.29 |
1.1971 times |
DMA SMA EMA moving averages of Cintas Corporation CTAS
DMA (daily moving average) of Cintas Corporation CTAS
| DMA period | DMA value | | 5 day DMA | 189.75 | | 12 day DMA | 191.72 | | 20 day DMA | 196.27 | | 35 day DMA | 198.78 | | 50 day DMA | 203.43 | | 100 day DMA | 212.52 | | 150 day DMA | 211.11 | | 200 day DMA | 208.24 | EMA (exponential moving average) of Cintas Corporation CTAS
| EMA period | EMA current | EMA prev | EMA prev2 | | 5 day EMA | 191.78 | 189.42 | 187.97 | | 12 day EMA | 192.61 | 191.91 | 191.83 | | 20 day EMA | 195.01 | 194.85 | 195.11 | | 35 day EMA | 199.62 | 199.8 | 200.24 | | 50 day EMA | 203.81 | 204.11 | 204.59 |
SMA (simple moving average) of Cintas Corporation CTAS
| SMA period | SMA current | SMA prev | SMA prev2 | | 5 day SMA | 189.75 | 188.09 | 187.22 | | 12 day SMA | 191.72 | 192.23 | 193.12 | | 20 day SMA | 196.27 | 196.47 | 196.99 | | 35 day SMA | 198.78 | 199.04 | 199.54 | | 50 day SMA | 203.43 | 203.96 | 204.59 | | 100 day SMA | 212.52 | 212.81 | 213.14 | | 150 day SMA | 211.11 | 211.08 | 211.07 | | 200 day SMA | 208.24 | 208.17 | 208.12 |
|
|
