CswIndustrials CSWI full analysis,charts,indicators,moving averages,SMA,DMA,EMA,ADX,MACD,RSICsw Industrials CSWI WideScreen charts, DMA,SMA,EMA technical analysis, forecast prediction, by indicators ADX,MACD,RSI,CCI USA stock exchange
operates under Basic Industries sector & deals in Home Furnishings
Daily price and charts and targets CswIndustrials Strong Daily Stock price targets for CswIndustrials CSWI are 309.67 and 317.81 | Daily Target 1 | 303.63 | | Daily Target 2 | 307.56 | | Daily Target 3 | 311.77333333333 | | Daily Target 4 | 315.7 | | Daily Target 5 | 319.91 |
Daily price and volume Csw Industrials
| Date |
Closing |
Open |
Range |
Volume |
| Mon 28 April 2025 |
311.48 (-0.2%) |
310.43 |
307.85 - 315.99 |
1.104 times |
| Fri 25 April 2025 |
312.09 (-0.7%) |
310.27 |
308.54 - 315.27 |
1.1397 times |
| Thu 24 April 2025 |
314.30 (5.16%) |
305.15 |
298.84 - 315.60 |
1.8068 times |
| Tue 22 April 2025 |
298.87 (2.64%) |
296.09 |
296.09 - 302.93 |
2.0411 times |
| Mon 21 April 2025 |
291.18 (-2.43%) |
295.00 |
286.85 - 295.00 |
0.0059 times |
| Thu 17 April 2025 |
298.43 (1.04%) |
294.69 |
293.59 - 299.36 |
1.3595 times |
| Wed 16 April 2025 |
295.36 (0%) |
295.25 |
290.00 - 298.13 |
0 times |
| Wed 16 April 2025 |
295.36 (0%) |
295.25 |
290.00 - 298.13 |
0 times |
| Wed 16 April 2025 |
295.36 (0%) |
295.25 |
290.00 - 298.13 |
2.543 times |
| Wed 16 April 2025 |
295.36 (0%) |
295.25 |
290.00 - 298.13 |
0 times |
| Wed 16 April 2025 |
295.36 (0%) |
295.25 |
290.00 - 298.13 |
0 times |
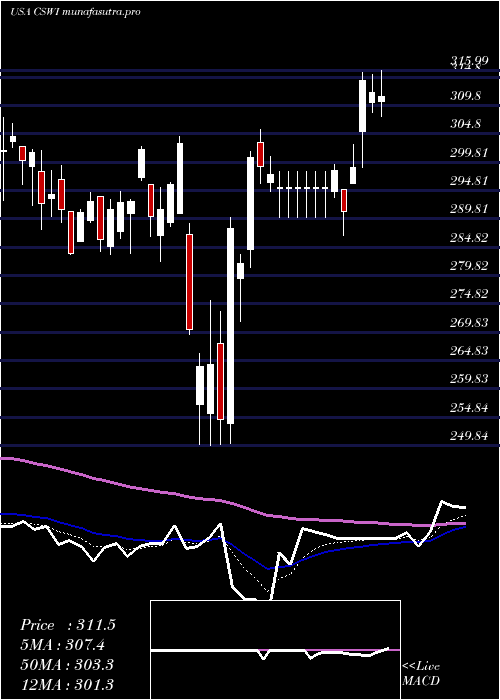
Weekly price and charts CswIndustrials Strong weekly Stock price targets for CswIndustrials CSWI are 309.67 and 317.81 | Weekly Target 1 | 303.63 | | Weekly Target 2 | 307.56 | | Weekly Target 3 | 311.77333333333 | | Weekly Target 4 | 315.7 | | Weekly Target 5 | 319.91 |
Weekly price and volumes for Csw Industrials
| Date |
Closing |
Open |
Range |
Volume |
| Mon 28 April 2025 |
311.48 (-0.2%) |
310.43 |
307.85 - 315.99 |
0.2365 times |
| Fri 25 April 2025 |
312.09 (4.58%) |
295.00 |
286.85 - 315.60 |
1.0699 times |
| Thu 17 April 2025 |
298.43 (1.04%) |
295.25 |
290.00 - 299.36 |
0.2913 times |
| Wed 16 April 2025 |
295.36 (0%) |
295.25 |
290.00 - 298.13 |
0 times |
| Wed 16 April 2025 |
295.36 (0%) |
295.25 |
290.00 - 298.13 |
0.5449 times |
| Wed 16 April 2025 |
295.36 (0%) |
295.25 |
290.00 - 298.13 |
0 times |
| Wed 16 April 2025 |
295.36 (0%) |
295.25 |
290.00 - 298.13 |
0 times |
| Wed 16 April 2025 |
295.36 (-1.75%) |
303.21 |
290.00 - 305.58 |
0.9678 times |
| Fri 11 April 2025 |
300.61 (13.96%) |
255.50 |
249.84 - 301.62 |
3.7824 times |
| Fri 04 April 2025 |
263.79 (-9.1%) |
286.91 |
250.02 - 304.40 |
3.1072 times |
| Fri 28 March 2025 |
290.19 (-0.89%) |
297.18 |
286.75 - 302.55 |
0.7381 times |
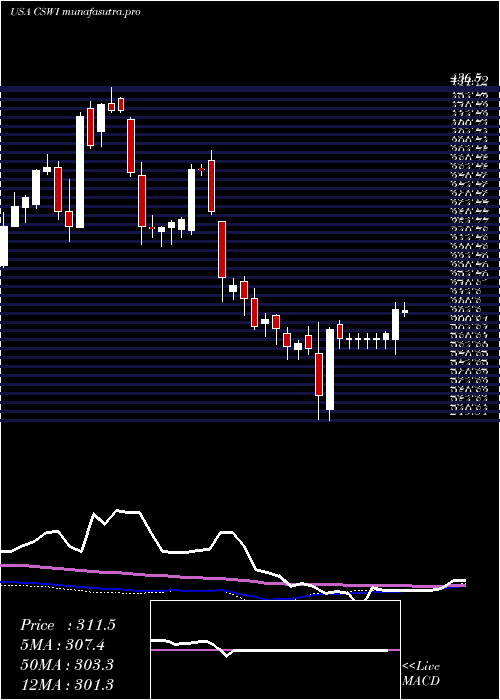
Monthly price and charts CswIndustrials Strong monthly Stock price targets for CswIndustrials CSWI are 280.66 and 346.81 | Monthly Target 1 | 226.29 | | Monthly Target 2 | 268.88 | | Monthly Target 3 | 292.43666666667 | | Monthly Target 4 | 335.03 | | Monthly Target 5 | 358.59 |
Monthly price and volumes Csw Industrials
| Date |
Closing |
Open |
Range |
Volume |
| Mon 28 April 2025 |
311.48 (6.85%) |
289.10 |
249.84 - 315.99 |
0.7703 times |
| Mon 31 March 2025 |
291.52 (-4.76%) |
308.25 |
282.23 - 308.95 |
0.9451 times |
| Fri 28 February 2025 |
306.09 (-7.19%) |
321.78 |
296.76 - 330.30 |
0.7796 times |
| Fri 31 January 2025 |
329.81 (-6.52%) |
354.65 |
316.57 - 401.02 |
0.9268 times |
| Tue 31 December 2024 |
352.80 (-16.71%) |
418.48 |
346.96 - 419.27 |
0.5292 times |
| Tue 26 November 2024 |
423.58 (19.96%) |
356.78 |
356.78 - 436.50 |
0.6872 times |
| Thu 31 October 2024 |
353.10 (-3.63%) |
366.65 |
350.23 - 398.80 |
1.0712 times |
| Mon 30 September 2024 |
366.39 (8.52%) |
335.93 |
282.61 - 377.38 |
2.9092 times |
| Fri 30 August 2024 |
337.63 (4.07%) |
322.00 |
285.81 - 337.63 |
0.6188 times |
| Wed 31 July 2024 |
324.42 (22.28%) |
265.92 |
260.49 - 325.75 |
0.7627 times |
| Fri 28 June 2024 |
265.31 (4.35%) |
255.71 |
248.90 - 274.00 |
0.9808 times |

DMA SMA EMA moving averages of Csw Industrials CSWI
DMA (daily moving average) of Csw Industrials CSWI
| DMA period | DMA value | | 5 day DMA | 305.58 | | 12 day DMA | 299.88 | | 20 day DMA | 292.41 | | 35 day DMA | 291.93 | | 50 day DMA | 295.6 | | 100 day DMA | 328.6 | | 150 day DMA | 347.03 | | 200 day DMA | 337.02 | EMA (exponential moving average) of Csw Industrials CSWI
| EMA period | EMA current | EMA prev | EMA prev2 | | 5 day EMA | 307.44 | 305.42 | 302.09 | | 12 day EMA | 301.31 | 299.46 | 297.16 | | 20 day EMA | 298.11 | 296.7 | 295.08 | | 35 day EMA | 297.7 | 296.89 | 295.99 | | 50 day EMA | 298.69 | 298.17 | 297.6 |
SMA (simple moving average) of Csw Industrials CSWI
| SMA period | SMA current | SMA prev | SMA prev2 | | 5 day SMA | 305.58 | 302.97 | 299.63 | | 12 day SMA | 299.88 | 298.73 | 297.64 | | 20 day SMA | 292.41 | 290.35 | 289.9 | | 35 day SMA | 291.93 | 291.38 | 291.08 | | 50 day SMA | 295.6 | 295.74 | 295.84 | | 100 day SMA | 328.6 | 329.8 | 330.95 | | 150 day SMA | 347.03 | 347.22 | 347.38 | | 200 day SMA | 337.02 | 336.83 | 336.63 |
|
|
