CanadianSolar CSIQ full analysis,charts,indicators,moving averages,SMA,DMA,EMA,ADX,MACD,RSICanadian Solar CSIQ WideScreen charts, DMA,SMA,EMA technical analysis, forecast prediction, by indicators ADX,MACD,RSI,CCI USA stock exchange
operates under Technology sector & deals in Semiconductors
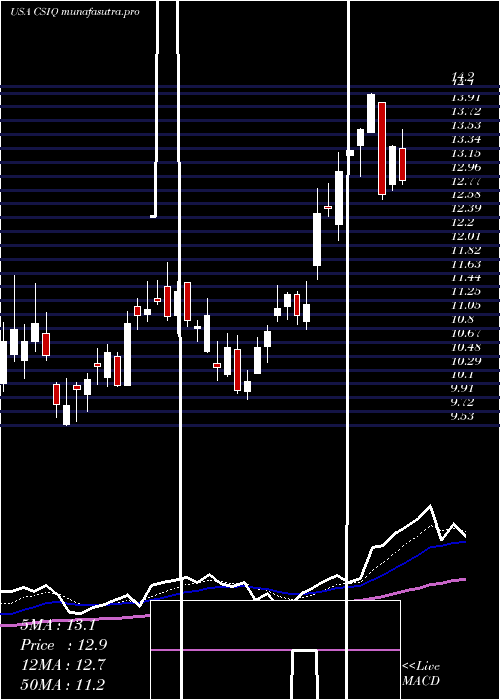
Daily price and charts and targets CanadianSolar Strong Daily Stock price targets for CanadianSolar CSIQ are 14.44 and 15.04 | Daily Target 1 | 14.31 | | Daily Target 2 | 14.56 | | Daily Target 3 | 14.91 | | Daily Target 4 | 15.16 | | Daily Target 5 | 15.51 |
Daily price and volume Canadian Solar
| Date |
Closing |
Open |
Range |
Volume |
Mon 20 October 2025 |
14.81 (1.51%) |
15.01 |
14.66 - 15.26 |
0.4396 times |
Fri 17 October 2025 |
14.59 (-6.53%) |
15.42 |
14.43 - 15.54 |
1.0926 times |
Thu 16 October 2025 |
15.61 (-1.2%) |
16.16 |
15.52 - 16.45 |
0.5967 times |
Wed 15 October 2025 |
15.80 (0.51%) |
16.41 |
15.39 - 17.07 |
1.2285 times |
Tue 14 October 2025 |
15.72 (10.78%) |
14.02 |
13.80 - 16.00 |
1.5848 times |
Mon 13 October 2025 |
14.19 (6.05%) |
14.40 |
14.03 - 14.79 |
0.759 times |
Fri 10 October 2025 |
13.38 (-16.22%) |
15.69 |
13.20 - 15.77 |
1.8388 times |
Thu 09 October 2025 |
15.97 (11.76%) |
14.47 |
14.38 - 16.12 |
1.3852 times |
Wed 08 October 2025 |
14.29 (-0.97%) |
14.53 |
14.15 - 14.82 |
0.5038 times |
Tue 07 October 2025 |
14.43 (-6.18%) |
15.13 |
14.30 - 15.13 |
0.5711 times |
Mon 06 October 2025 |
15.38 (1.18%) |
15.19 |
14.93 - 15.66 |
0.4209 times |
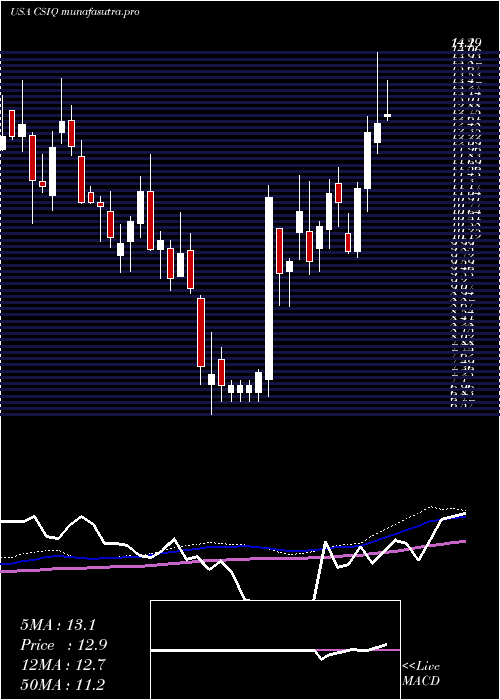
Weekly price and charts CanadianSolar Strong weekly Stock price targets for CanadianSolar CSIQ are 14.44 and 15.04 | Weekly Target 1 | 14.31 | | Weekly Target 2 | 14.56 | | Weekly Target 3 | 14.91 | | Weekly Target 4 | 15.16 | | Weekly Target 5 | 15.51 |
Weekly price and volumes for Canadian Solar
| Date |
Closing |
Open |
Range |
Volume |
Mon 20 October 2025 |
14.81 (1.51%) |
15.01 |
14.66 - 15.26 |
0.1332 times |
Fri 17 October 2025 |
14.59 (9.04%) |
14.40 |
13.80 - 17.07 |
1.5943 times |
Fri 10 October 2025 |
13.38 (-11.97%) |
15.19 |
13.20 - 16.12 |
1.4301 times |
Fri 03 October 2025 |
15.20 (17.37%) |
13.30 |
12.58 - 16.02 |
1.3817 times |
Fri 26 September 2025 |
12.95 (10.68%) |
11.68 |
11.68 - 13.55 |
0.8881 times |
Fri 19 September 2025 |
11.70 (7.44%) |
11.16 |
11.06 - 12.63 |
1.2066 times |
Fri 12 September 2025 |
10.89 (-2.51%) |
11.51 |
10.56 - 11.61 |
0.8487 times |
Fri 05 September 2025 |
11.17 (14.21%) |
9.63 |
9.41 - 11.26 |
1.1649 times |
Fri 29 August 2025 |
9.78 (0%) |
9.52 |
9.52 - 10.03 |
0.2393 times |
Fri 29 August 2025 |
9.78 (-11.65%) |
10.89 |
9.45 - 11.81 |
1.1132 times |
Fri 22 August 2025 |
11.07 (-11.79%) |
12.80 |
10.01 - 13.22 |
1.2925 times |
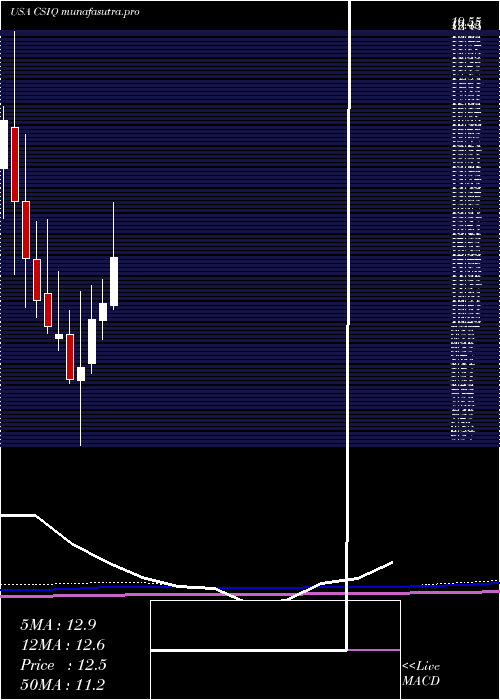
Monthly price and charts CanadianSolar Strong monthly Stock price targets for CanadianSolar CSIQ are 13.97 and 17.91 | Monthly Target 1 | 11.06 | | Monthly Target 2 | 12.94 | | Monthly Target 3 | 15.003333333333 | | Monthly Target 4 | 16.88 | | Monthly Target 5 | 18.94 |
Monthly price and volumes Canadian Solar
| Date |
Closing |
Open |
Range |
Volume |
Mon 20 October 2025 |
14.81 (13.57%) |
13.19 |
13.13 - 17.07 |
1.1203 times |
Tue 30 September 2025 |
13.04 (33.33%) |
9.63 |
9.41 - 13.55 |
1.1409 times |
Fri 29 August 2025 |
9.78 (-14.88%) |
11.35 |
9.45 - 13.35 |
0.9023 times |
Thu 31 July 2025 |
11.49 (4.08%) |
10.96 |
10.85 - 14.20 |
0.8123 times |
Mon 30 June 2025 |
11.04 (4.84%) |
10.48 |
9.89 - 11.77 |
0.5009 times |
Fri 30 May 2025 |
10.53 (16.74%) |
9.16 |
8.84 - 11.60 |
0.907 times |
Wed 30 April 2025 |
9.02 (4.28%) |
8.62 |
6.57 - 11.39 |
1.7008 times |
Mon 31 March 2025 |
8.65 (-13.93%) |
10.06 |
8.52 - 10.82 |
0.9169 times |
Fri 28 February 2025 |
10.05 (-2.52%) |
9.92 |
9.56 - 12.04 |
0.9358 times |
Fri 31 January 2025 |
10.31 (-7.28%) |
11.35 |
10.09 - 13.66 |
1.0629 times |
Tue 31 December 2024 |
11.12 (-10.54%) |
12.42 |
10.60 - 13.61 |
0.8427 times |
DMA SMA EMA moving averages of Canadian Solar CSIQ
DMA (daily moving average) of Canadian Solar CSIQ
| DMA period | DMA value | | 5 day DMA | 15.31 | | 12 day DMA | 14.95 | | 20 day DMA | 14.36 | | 35 day DMA | 13 | | 50 day DMA | 12.48 | | 100 day DMA | 12.1 | | 150 day DMA | 11.07 | | 200 day DMA | 10.98 | EMA (exponential moving average) of Canadian Solar CSIQ
| EMA period | EMA current | EMA prev | EMA prev2 | | 5 day EMA | 14.98 | 15.06 | 15.3 | | 12 day EMA | 14.74 | 14.73 | 14.76 | | 20 day EMA | 14.29 | 14.23 | 14.19 | | 35 day EMA | 13.54 | 13.46 | 13.39 | | 50 day EMA | 12.71 | 12.62 | 12.54 |
SMA (simple moving average) of Canadian Solar CSIQ
| SMA period | SMA current | SMA prev | SMA prev2 | | 5 day SMA | 15.31 | 15.18 | 14.94 | | 12 day SMA | 14.95 | 14.99 | 15.02 | | 20 day SMA | 14.36 | 14.25 | 14.11 | | 35 day SMA | 13 | 12.86 | 12.72 | | 50 day SMA | 12.48 | 12.42 | 12.36 | | 100 day SMA | 12.1 | 12.05 | 12.01 | | 150 day SMA | 11.07 | 11.04 | 11 | | 200 day SMA | 10.98 | 10.97 | 10.95 |
|
|
