CostarGroup CSGP full analysis,charts,indicators,moving averages,SMA,DMA,EMA,ADX,MACD,RSICostar Group CSGP WideScreen charts, DMA,SMA,EMA technical analysis, forecast prediction, by indicators ADX,MACD,RSI,CCI USA stock exchange
operates under Miscellaneous sector & deals in Business Services
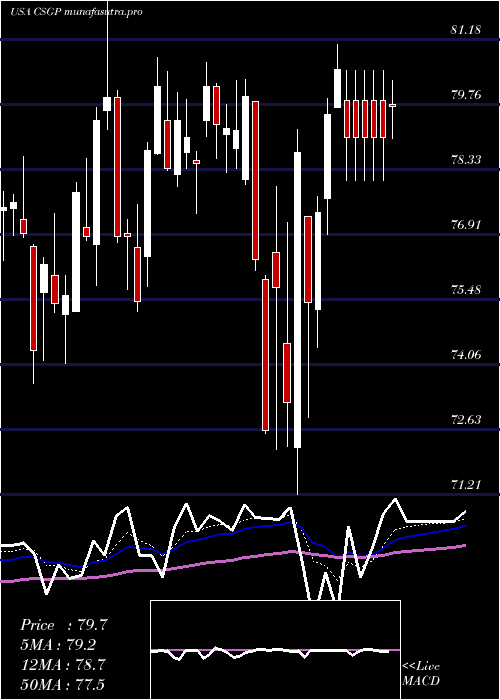
Daily price and charts and targets CostarGroup Strong Daily Stock price targets for CostarGroup CSGP are 75.49 and 78.34 | Daily Target 1 | 73.14 | | Daily Target 2 | 74.99 | | Daily Target 3 | 75.986666666667 | | Daily Target 4 | 77.84 | | Daily Target 5 | 78.84 |
Daily price and volume Costar Group
| Date |
Closing |
Open |
Range |
Volume |
Tue 21 October 2025 |
76.85 (2.52%) |
74.64 |
74.13 - 76.98 |
0.9833 times |
Mon 20 October 2025 |
74.96 (1.31%) |
74.02 |
73.92 - 75.03 |
0.6735 times |
Fri 17 October 2025 |
73.99 (-0.48%) |
74.18 |
73.58 - 74.89 |
0.9896 times |
Thu 16 October 2025 |
74.35 (-1.12%) |
75.63 |
73.97 - 76.32 |
0.8239 times |
Wed 15 October 2025 |
75.19 (-0.71%) |
75.65 |
74.26 - 75.97 |
0.9887 times |
Tue 14 October 2025 |
75.73 (0.73%) |
74.56 |
74.50 - 76.09 |
1.1225 times |
Mon 13 October 2025 |
75.18 (-0.53%) |
76.42 |
75.12 - 76.42 |
1.0725 times |
Fri 10 October 2025 |
75.58 (-2.52%) |
77.43 |
75.39 - 77.82 |
1.0278 times |
Thu 09 October 2025 |
77.53 (-1.86%) |
79.01 |
77.40 - 79.21 |
0.8857 times |
Wed 08 October 2025 |
79.00 (-1.99%) |
80.45 |
78.60 - 80.55 |
1.4326 times |
Tue 07 October 2025 |
80.60 (-0.68%) |
81.22 |
79.80 - 81.45 |
0.8026 times |
Weekly price and charts CostarGroup Strong weekly Stock price targets for CostarGroup CSGP are 75.39 and 78.45 | Weekly Target 1 | 72.86 | | Weekly Target 2 | 74.85 | | Weekly Target 3 | 75.916666666667 | | Weekly Target 4 | 77.91 | | Weekly Target 5 | 78.98 |
Weekly price and volumes for Costar Group
| Date |
Closing |
Open |
Range |
Volume |
Tue 21 October 2025 |
76.85 (3.87%) |
74.02 |
73.92 - 76.98 |
0.4345 times |
Fri 17 October 2025 |
73.99 (-2.1%) |
76.42 |
73.58 - 76.42 |
1.3105 times |
Fri 10 October 2025 |
75.58 (-10.87%) |
85.11 |
75.39 - 85.24 |
1.464 times |
Fri 03 October 2025 |
84.80 (0.96%) |
84.73 |
82.58 - 85.08 |
1.2022 times |
Fri 26 September 2025 |
83.99 (-3.57%) |
86.70 |
82.79 - 86.99 |
1.3535 times |
Fri 19 September 2025 |
87.10 (0.35%) |
87.14 |
86.92 - 90.72 |
1.4312 times |
Fri 12 September 2025 |
86.80 (-2.97%) |
89.16 |
85.13 - 91.00 |
1.0938 times |
Fri 05 September 2025 |
89.46 (-0.03%) |
88.87 |
87.35 - 91.89 |
0.6645 times |
Fri 29 August 2025 |
89.49 (0%) |
90.14 |
89.11 - 90.54 |
0.1757 times |
Fri 29 August 2025 |
89.49 (-1.9%) |
90.86 |
88.14 - 91.48 |
0.87 times |
Fri 22 August 2025 |
91.22 (1.74%) |
89.26 |
87.49 - 91.50 |
1.1571 times |

Monthly price and charts CostarGroup Strong monthly Stock price targets for CostarGroup CSGP are 69.39 and 81.05 | Monthly Target 1 | 66.9 | | Monthly Target 2 | 71.87 | | Monthly Target 3 | 78.556666666667 | | Monthly Target 4 | 83.53 | | Monthly Target 5 | 90.22 |
Monthly price and volumes Costar Group
| Date |
Closing |
Open |
Range |
Volume |
Tue 21 October 2025 |
76.85 (-8.91%) |
84.21 |
73.58 - 85.24 |
0.7148 times |
Tue 30 September 2025 |
84.37 (-5.72%) |
88.87 |
82.79 - 91.89 |
0.9351 times |
Fri 29 August 2025 |
89.49 (-5.99%) |
94.70 |
84.57 - 97.43 |
0.9256 times |
Thu 31 July 2025 |
95.19 (18.4%) |
80.40 |
79.94 - 97.15 |
1.0515 times |
Mon 30 June 2025 |
80.40 (9.3%) |
72.84 |
71.35 - 83.48 |
0.9229 times |
Fri 30 May 2025 |
73.56 (-0.82%) |
74.74 |
71.94 - 78.56 |
1.0284 times |
Wed 30 April 2025 |
74.17 (-6.39%) |
78.79 |
71.21 - 83.60 |
1.2703 times |
Mon 31 March 2025 |
79.23 (3.91%) |
76.01 |
74.08 - 83.03 |
1.1503 times |
Fri 28 February 2025 |
76.25 (-0.46%) |
76.52 |
72.50 - 79.45 |
1.1496 times |
Fri 31 January 2025 |
76.60 (7%) |
72.17 |
68.41 - 77.54 |
0.8515 times |
Tue 31 December 2024 |
71.59 (-10.42%) |
77.36 |
69.75 - 79.11 |
0.665 times |

DMA SMA EMA moving averages of Costar Group CSGP
DMA (daily moving average) of Costar Group CSGP
| DMA period | DMA value | | 5 day DMA | 75.07 | | 12 day DMA | 76.68 | | 20 day DMA | 79.6 | | 35 day DMA | 83.08 | | 50 day DMA | 84.89 | | 100 day DMA | 84.8 | | 150 day DMA | 82.38 | | 200 day DMA | 80.64 | EMA (exponential moving average) of Costar Group CSGP
| EMA period | EMA current | EMA prev | EMA prev2 | | 5 day EMA | 75.65 | 75.05 | 75.1 | | 12 day EMA | 77.1 | 77.14 | 77.54 | | 20 day EMA | 79.05 | 79.28 | 79.74 | | 35 day EMA | 81.86 | 82.15 | 82.57 | | 50 day EMA | 84.62 | 84.94 | 85.35 |
SMA (simple moving average) of Costar Group CSGP
| SMA period | SMA current | SMA prev | SMA prev2 | | 5 day SMA | 75.07 | 74.84 | 74.89 | | 12 day SMA | 76.68 | 77.34 | 78.08 | | 20 day SMA | 79.6 | 80.02 | 80.59 | | 35 day SMA | 83.08 | 83.4 | 83.81 | | 50 day SMA | 84.89 | 85.12 | 85.47 | | 100 day SMA | 84.8 | 84.78 | 84.77 | | 150 day SMA | 82.38 | 82.4 | 82.42 | | 200 day SMA | 80.64 | 80.62 | 80.6 |
|
|
