ChampionsOncology CSBR full analysis,charts,indicators,moving averages,SMA,DMA,EMA,ADX,MACD,RSIChampions Oncology CSBR WideScreen charts, DMA,SMA,EMA technical analysis, forecast prediction, by indicators ADX,MACD,RSI,CCI USA stock exchange
operates under Health Care sector & deals in Biotechnology Biological Products No Diagnostic Substances
Daily price and charts and targets ChampionsOncology Strong Daily Stock price targets for ChampionsOncology CSBR are 6.56 and 6.73 | Daily Target 1 | 6.42 | | Daily Target 2 | 6.53 | | Daily Target 3 | 6.59 | | Daily Target 4 | 6.7 | | Daily Target 5 | 6.76 |
Daily price and volume Champions Oncology
| Date |
Closing |
Open |
Range |
Volume |
Tue 21 October 2025 |
6.64 (1.68%) |
6.54 |
6.48 - 6.65 |
0.3509 times |
Mon 20 October 2025 |
6.53 (0.62%) |
6.27 |
6.27 - 6.64 |
0.2673 times |
Fri 17 October 2025 |
6.49 (-1.07%) |
6.44 |
6.37 - 6.50 |
0.919 times |
Thu 16 October 2025 |
6.56 (-0.3%) |
6.44 |
6.43 - 6.79 |
0.3676 times |
Wed 15 October 2025 |
6.58 (-0.45%) |
6.52 |
6.39 - 6.74 |
1.4035 times |
Tue 14 October 2025 |
6.61 (1.54%) |
6.29 |
6.29 - 6.61 |
0.2924 times |
Mon 13 October 2025 |
6.51 (-0.46%) |
6.45 |
6.35 - 6.54 |
0.8187 times |
Fri 10 October 2025 |
6.54 (-0.3%) |
6.57 |
6.32 - 6.57 |
1.2865 times |
Thu 09 October 2025 |
6.56 (1.39%) |
6.42 |
6.38 - 6.73 |
1.4787 times |
Wed 08 October 2025 |
6.47 (-1.07%) |
6.48 |
6.47 - 6.89 |
2.8154 times |
Tue 07 October 2025 |
6.54 (1.87%) |
6.43 |
6.43 - 6.54 |
0.3676 times |
Weekly price and charts ChampionsOncology Strong weekly Stock price targets for ChampionsOncology CSBR are 6.46 and 6.84 | Weekly Target 1 | 6.14 | | Weekly Target 2 | 6.39 | | Weekly Target 3 | 6.52 | | Weekly Target 4 | 6.77 | | Weekly Target 5 | 6.9 |
Weekly price and volumes for Champions Oncology
| Date |
Closing |
Open |
Range |
Volume |
Tue 21 October 2025 |
6.64 (2.31%) |
6.27 |
6.27 - 6.65 |
0.0673 times |
Fri 17 October 2025 |
6.49 (-0.76%) |
6.45 |
6.29 - 6.79 |
0.414 times |
Fri 10 October 2025 |
6.54 (3.81%) |
6.39 |
6.32 - 6.89 |
0.706 times |
Fri 03 October 2025 |
6.30 (0%) |
6.26 |
5.89 - 6.60 |
0.6808 times |
Fri 26 September 2025 |
6.30 (-4.11%) |
6.58 |
6.22 - 6.90 |
0.8206 times |
Fri 19 September 2025 |
6.57 (-3.81%) |
7.00 |
6.20 - 8.74 |
4.549 times |
Fri 12 September 2025 |
6.83 (-0.15%) |
6.79 |
6.33 - 6.87 |
1.3247 times |
Fri 05 September 2025 |
6.84 (0.59%) |
6.66 |
6.65 - 7.25 |
0.323 times |
Fri 29 August 2025 |
6.80 (0%) |
6.67 |
6.61 - 6.81 |
0.161 times |
Fri 29 August 2025 |
6.80 (-10.88%) |
7.24 |
6.59 - 7.31 |
0.9535 times |
Fri 22 August 2025 |
7.63 (17.02%) |
6.80 |
6.69 - 8.20 |
1.2473 times |

Monthly price and charts ChampionsOncology Strong monthly Stock price targets for ChampionsOncology CSBR are 6.27 and 7.27 | Monthly Target 1 | 5.47 | | Monthly Target 2 | 6.06 | | Monthly Target 3 | 6.4733333333333 | | Monthly Target 4 | 7.06 | | Monthly Target 5 | 7.47 |
Monthly price and volumes Champions Oncology
| Date |
Closing |
Open |
Range |
Volume |
Tue 21 October 2025 |
6.64 (2.63%) |
6.50 |
5.89 - 6.89 |
0.2437 times |
Tue 30 September 2025 |
6.47 (-4.85%) |
6.66 |
6.20 - 8.74 |
1.0724 times |
Fri 29 August 2025 |
6.80 (7.59%) |
6.32 |
5.85 - 8.20 |
0.7265 times |
Thu 31 July 2025 |
6.32 (-14.25%) |
7.33 |
6.06 - 9.63 |
1.0784 times |
Mon 30 June 2025 |
7.37 (25.55%) |
5.86 |
5.61 - 8.58 |
1.0014 times |
Fri 30 May 2025 |
5.87 (-17.9%) |
7.20 |
5.59 - 7.48 |
0.918 times |
Wed 30 April 2025 |
7.15 (-17.63%) |
9.02 |
7.01 - 9.17 |
1.0341 times |
Mon 31 March 2025 |
8.68 (-15.56%) |
10.32 |
8.60 - 11.06 |
1.1234 times |
Fri 28 February 2025 |
10.28 (-6.46%) |
10.89 |
9.30 - 11.98 |
1.0421 times |
Fri 31 January 2025 |
10.99 (28.24%) |
8.48 |
7.81 - 11.99 |
1.7599 times |
Tue 31 December 2024 |
8.57 (97.92%) |
4.62 |
4.54 - 9.53 |
2.0438 times |

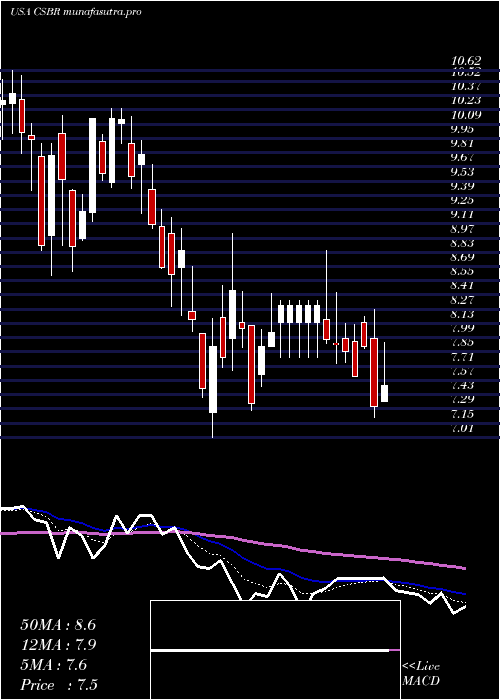
DMA SMA EMA moving averages of Champions Oncology CSBR
DMA (daily moving average) of Champions Oncology CSBR
| DMA period | DMA value | | 5 day DMA | 6.56 | | 12 day DMA | 6.54 | | 20 day DMA | 6.48 | | 35 day DMA | 6.62 | | 50 day DMA | 6.72 | | 100 day DMA | 6.98 | | 150 day DMA | 7.14 | | 200 day DMA | 7.93 | EMA (exponential moving average) of Champions Oncology CSBR
| EMA period | EMA current | EMA prev | EMA prev2 | | 5 day EMA | 6.57 | 6.53 | 6.53 | | 12 day EMA | 6.54 | 6.52 | 6.52 | | 20 day EMA | 6.55 | 6.54 | 6.54 | | 35 day EMA | 6.6 | 6.6 | 6.6 | | 50 day EMA | 6.67 | 6.67 | 6.68 |
SMA (simple moving average) of Champions Oncology CSBR
| SMA period | SMA current | SMA prev | SMA prev2 | | 5 day SMA | 6.56 | 6.55 | 6.55 | | 12 day SMA | 6.54 | 6.51 | 6.5 | | 20 day SMA | 6.48 | 6.48 | 6.49 | | 35 day SMA | 6.62 | 6.63 | 6.64 | | 50 day SMA | 6.72 | 6.72 | 6.72 | | 100 day SMA | 6.98 | 6.97 | 6.96 | | 150 day SMA | 7.14 | 7.16 | 7.18 | | 200 day SMA | 7.93 | 7.94 | 7.95 |
|
|
